3M 2009 Annual Report Download - page 94
Download and view the complete annual report
Please find page 94 of the 2009 3M annual report below. You can navigate through the pages in the report by either clicking on the pages listed below, or by using the keyword search tool below to find specific information within the annual report.-
 1
1 -
2
-
3
-
4
-
5
-
6
-
7
-
8
-
9
-
10
-
11
-
12
-
13
-
14
-
15
-
16
-
17
-
18
-
19
-
20
-
21
-
22
-
23
-
24
-
25
-
26
-
27
-
28
-
29
-
30
-
31
-
32
-
33
-
34
-
35
-
36
-
37
-
38
-
39
-
40
-
41
-
42
-
43
-
44
-
45
-
46
-
47
-
48
-
49
-
50
-
51
-
52
-
53
-
54
-
55
-
56
-
57
-
58
-
59
-
60
-
61
-
62
-
63
-
64
-
65
-
66
-
67
-
68
-
69
-
70
-
71
-
72
-
73
-
74
-
75
-
76
-
77
-
78
-
79
-
80
-
81
-
82
-
83
-
 84
84 -
 85
85 -
 86
86 -
 87
87 -
 88
88 -
 89
89 -
 90
90 -
 91
91 -
 92
92 -
 93
93 -
 94
94 -
 95
95 -
 96
96 -
 97
97 -
 98
98 -
 99
99 -
 100
100 -
 101
101 -
 102
102 -
 103
103 -
 104
104 -
105
-
106
-
107
-
108
-
109
-
110
-
111
-
112
-
113
-
114
-
115
-
116
-
117
-
118
-
119
-
120
-
121
-
122
-
123
-
124
-
125
-
126
-
127
-
128
-
129
-
130
-
131
-
132
 |
 |

88
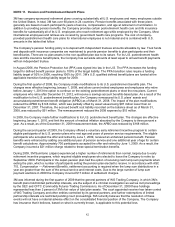
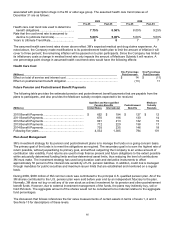
Other items to reconcile to fair value of plan assets is the net of interest receivable, amounts due for securities sold,
amounts payable for securities purchased and interest payable.
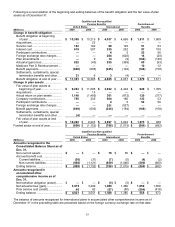
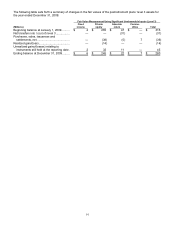
The following table sets forth a summary of changes in the fair values of the U.S. pension plans’ level 3 assets for the
year ended December 31, 2009:
Fair Value Measurement Using Significant Unobservable Inputs (Level 3)
(Millions)
Global
equity
Fixed
income
Private
equity
Absolute
return
Comm-
odities Total
Beginning balance at January 1,
2009.............................................. $ 1 $ 122 $ 2,054 $ 1,548 $ — $ 3,725
Net transfers into / (out of) level 3 .... (106) — — (1,043) — (1,149)
Purchases, sales, issuances and
settlements, net ............................ 1 11 (241) (162) 237 (154)
Realized gain/(loss)..........................
—
1 (9) (4) — (12)
Unrealized gains/(losses) relating
to instruments still held at the
reporting date................................ 108 51 157 389 — 705
Ending balance at December 31,
2009.............................................. $ 4 $ 185 $ 1,961 $ 728 $ 237 $ 3,115
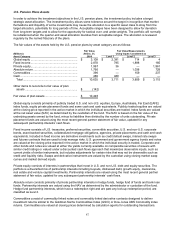
International Pension Plans Assets
Outside the U.S., pension plan assets are typically managed by decentralized fiduciary committees. The disclosure
below of asset categories is presented in aggregate for the 55 plans in 23 countries, however there is significant
variation in policy asset allocation from country to country. Local regulations, local funding rules, and local financial
and tax considerations are part of the funding and investment allocation process in each country. 3M’s Treasury
group provides standard funding and investment guidance to all international plans with more focused guidance to
the larger plans.
Each plan has its own strategic asset allocation. The asset allocations are reviewed periodically and rebalanced
when necessary.
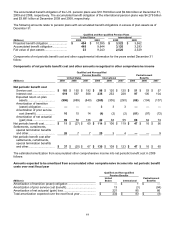
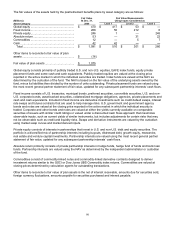
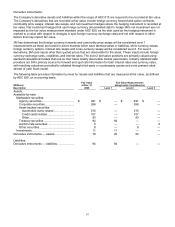
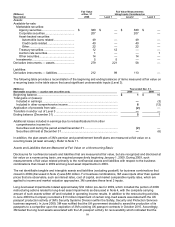
The fair values of the assets held by the international pension plans by asset category are as follows:
(Millions)
Fair Value
At Dec. 31,
Fair Value Measurements
Using Inputs Considered as
Asset Category 2009 Level 1 Level 2 Level 3
Global equity ........................................................ $ 1,619 $ 1,330 $ 275 $ 14
Domestic fixed income ......................................... 936 283 623 30
Foreign fixed income............................................ 622 222 400 —
Real estate ........................................................... 54 — 3 51
Insurance.............................................................. 375 — — 375
Other .................................................................... 104 — 104 —
Cash ..................................................................... 208 208 — —
Total.................................................................. $ 3,918 $ 2,043 $ 1,405 $ 470
Other items to reconcile to fair value of plan
assets ............................................................... $ (21)
Fair value of plan assets ...................................... $ 3,897
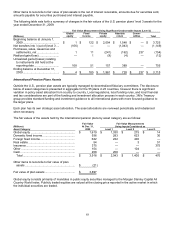
Global equity consists primarily of mandates in public equity securities managed to the Morgan Stanley Capital All
Country World Index. Publicly traded equities are valued at the closing price reported in the active market in which
the individual securities are traded.