3M 2009 Annual Report Download - page 18
Download and view the complete annual report
Please find page 18 of the 2009 3M annual report below. You can navigate through the pages in the report by either clicking on the pages listed below, or by using the keyword search tool below to find specific information within the annual report.-
 1
1 -
2
-
3
-
4
-
5
-
6
-
7
-
 8
8 -
 9
9 -
 10
10 -
 11
11 -
 12
12 -
 13
13 -
 14
14 -
 15
15 -
 16
16 -
 17
17 -
 18
18 -
 19
19 -
 20
20 -
 21
21 -
 22
22 -
 23
23 -
 24
24 -
 25
25 -
 26
26 -
 27
27 -
 28
28 -
29
-
30
-
31
-
32
-
33
-
34
-
35
-
36
-
37
-
38
-
39
-
40
-
41
-
42
-
43
-
44
-
45
-
46
-
47
-
48
-
49
-
50
-
51
-
52
-
53
-
54
-
55
-
56
-
57
-
58
-
59
-
60
-
61
-
62
-
63
-
64
-
65
-
66
-
67
-
68
-
69
-
70
-
71
-
72
-
73
-
74
-
75
-
76
-
77
-
78
-
79
-
80
-
81
-
82
-
83
-
84
-
85
-
86
-
87
-
88
-
89
-
90
-
91
-
92
-
93
-
94
-
95
-
96
-
97
-
98
-
99
-
100
-
101
-
102
-
103
-
104
-
105
-
106
-
107
-
108
-
109
-
110
-
111
-
112
-
113
-
114
-
115
-
116
-
117
-
118
-
119
-
120
-
121
-
122
-
123
-
124
-
125
-
126
-
127
-
128
-
129
-
130
-
131
-
132
 |
 |

12
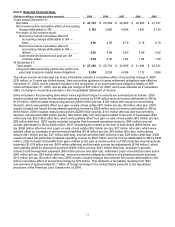
Item 6. Selected Financial Data.
(Dollars in millions, except per share amounts) 2009 2008 2007 2006 2005
Years ended December 31:
Net sales................................................................. $ 23,123 $ 25,269 $ 24,462 $ 22,923 $ 21,167
Net income before cumulative effect of accounting
change attributable to 3M ................................... 3,193 3,460 4,096 3,851 3,139
Per share of 3M common stock:
Net income before cumulative effect of
accounting change attributable to 3M —
basic ................................................................ 4.56 4.95 5.70 5.15 4.10
Net income before cumulative effect of
accounting change attributable to 3M —
diluted .............................................................. 4.52 4.89 5.60 5.06 4.02
Cash dividends declared and paid per 3M
common share................................................. 2.04 2.00 1.92 1.84 1.68
At December 31:
Total assets ............................................................ $ 27,250 $ 25,793 $ 24,699 $ 21,294 $ 20,541
Long-term debt (excluding portion due within one
year) and long-term capital lease obligations ..... 5,204 5,224 4,088 1,112 1,368
The above income and earnings per share information exclude a cumulative effect of accounting change in 2005
($35 million, or 5 cents per diluted share). New accounting guidance for asset retirement obligations was effective
December 31, 2005, and its adoption resulted in the recognition of an asset retirement obligation liability of $59
million at December 31, 2005, and an after-tax charge of $35 million for 2005, which was reflected as a cumulative
effect of change in accounting principle in the Consolidated Statement of Income.
Items included in the preceding table which had a significant impact on results are summarized as follows. 2009
results included net losses that decreased operating income by $194 million and net income attributable to 3M by
$119 million. 2009 included restructuring actions ($209 million pre-tax, $128 million after tax and noncontrolling
interest), which was partially offset by a gain on sale of real estate ($15 million pre-tax, $9 million after tax). 2008
results included net losses that decreased operating income by $269 million and net income attributable to 3M by
$194 million. 2008 included restructuring actions ($229 million pre-tax, $147 million after-tax and noncontrolling
interest), exit activities ($58 million pre-tax, $43 million after-tax) and losses related to the sale of businesses ($23
million pre-tax, $32 million after-tax), which were partially offset by a gain on sale of real estate ($41 million pre-tax,
$28 million after-tax). 2007 results included net gains that increased operating income by $681 million and net
income attributable to 3M by $448 million. 2007 included gains related to the sale of businesses ($849 million pre-
tax, $550 million after-tax) and a gain on sale of real estate ($52 million pre-tax, $37 million after-tax), which were
partially offset by increases in environmental liabilities ($134 million pre-tax, $83 million after-tax), restructuring
actions ($41 million pre-tax, $27 million after-tax), and exit activities ($45 million pre-tax, $29 million after-tax). 2006
results included net gains that increased operating income by $523 million and net income attributable to 3M by $438
million. 2006 included net benefits from gains related to the sale of certain portions of 3M’s branded pharmaceuticals
business ($1.074 billion pre-tax, $674 million after-tax) and favorable income tax adjustments ($149 million), which
were partially offset by restructuring actions ($403 million pre-tax, $257 million after-tax), acquired in-process
research and development expenses ($95 million pre-tax and after-tax), settlement costs of an antitrust class action
($40 million pre-tax, $25 million after-tax), and environmental obligations related to the pharmaceuticals business
($13 million pre-tax, $8 million after-tax). 2005 results included charges that reduced net income attributable to 3M
before cumulative effect of accounting change by $75 million. This related to a tax liability resulting from 3M’s
reinvestment of approximately $1.7 billion of foreign earnings in the United States pursuant to the repatriation
provisions of the American Jobs Creation Act of 2004.