3M 2009 Annual Report Download - page 122
Download and view the complete annual report
Please find page 122 of the 2009 3M annual report below. You can navigate through the pages in the report by either clicking on the pages listed below, or by using the keyword search tool below to find specific information within the annual report.-
 1
1 -
2
-
3
-
4
-
5
-
6
-
7
-
8
-
9
-
10
-
11
-
12
-
13
-
14
-
15
-
16
-
17
-
18
-
19
-
20
-
21
-
22
-
23
-
24
-
25
-
26
-
27
-
28
-
29
-
30
-
31
-
32
-
33
-
34
-
35
-
36
-
37
-
38
-
39
-
40
-
41
-
42
-
43
-
44
-
45
-
46
-
47
-
48
-
49
-
50
-
51
-
52
-
53
-
54
-
55
-
56
-
57
-
58
-
59
-
60
-
61
-
62
-
63
-
64
-
65
-
66
-
67
-
68
-
69
-
70
-
71
-
72
-
73
-
74
-
75
-
76
-
77
-
78
-
79
-
80
-
81
-
82
-
83
-
84
-
85
-
86
-
87
-
88
-
89
-
90
-
91
-
92
-
93
-
94
-
95
-
96
-
97
-
98
-
99
-
100
-
101
-
102
-
103
-
104
-
105
-
106
-
107
-
108
-
109
-
110
-
111
-
 112
112 -
 113
113 -
 114
114 -
 115
115 -
 116
116 -
 117
117 -
 118
118 -
 119
119 -
 120
120 -
 121
121 -
 122
122 -
 123
123 -
 124
124 -
 125
125 -
 126
126 -
 127
127 -
 128
128 -
 129
129 -
 130
130 -
 131
131 -
 132
132
 |
 |

116
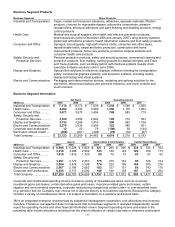
assets. However, the separate amounts stated for segment depreciation, amortization, and capital expenditures are
based on secondary performance measures used by management that do not include allocations of certain corporate
items.
Segment assets for the operating business segments (excluding Corporate and Unallocated) primarily include
accounts receivable; inventory; property, plant and equipment — net; goodwill and intangible assets; and other
miscellaneous assets. Assets included in Corporate and Unallocated principally are cash, cash equivalents and
marketable securities; insurance receivables; deferred income taxes; certain investments and other assets, including
prepaid pension assets. Corporate and unallocated assets can change from year to year due to changes in cash,
cash equivalents and marketable securities, changes in prepaid pension benefits, and changes in other unallocated
asset categories.
The most significant items impacting 2009 and 2008 results were restructuring actions and exit activities. The most
significant items impacting 2007 results are the net gain on sale of the pharmaceuticals business (within the Health
Care segment) and restructuring and other actions. Refer to Note 4 for discussion of restructuring actions and exit
activities and Note 2 for discussion of divestitures.
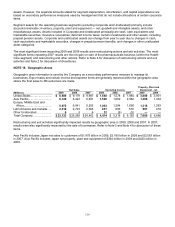
NOTE 18. Geographic Areas
Geographic area information is used by the Company as a secondary performance measure to manage its
businesses. Export sales and certain income and expense items are generally reported within the geographic area
where the final sales to 3M customers are made.
Net Sales Operating Income
Property, Plant and
Equipment - net
(Millions) 2009 2008 2007 2009 2008 2007 2009 2008
United States.......................... $ 8,509 $ 9,179 $ 8,987 $ 1,640 $ 1,578 $ 1,894 $ 3,809 $ 3,901
Asia Pacific............................. 6,120 6,423 6,601 1,528 1,662 2,062 1,366 1,304
Europe, Middle East and
Africa................................... 5,972 6,941 6,503 1,003 1,294 1,626 1,318 1,263
Latin America and Canada..... 2,516 2,723 2,365 631 693 616 507 418
Other Unallocated .................. 6
3 6 12 (9) (5) — —
Total Company ....................... $ 23,123 $ 25,269 $ 24,462 $ 4,814 $ 5,218 $ 6,193 $ 7,000 $ 6,886
Restructuring and exit activities significantly impacted results by geographic area in 2009, 2008 and 2007. In 2007,
results were also significantly impacted by the sale of businesses. Refer to Note 2 and Note 4 for discussion of these
items.
Asia Pacific includes Japan net sales to customers of $1.979 billion in 2009, $2.180 billion in 2008 and $2.063 billion
in 2007. Asia Pacific includes Japan net property, plant and equipment of $364 million in 2009 and $420 million in
2008.