3M 2009 Annual Report Download - page 81
Download and view the complete annual report
Please find page 81 of the 2009 3M annual report below. You can navigate through the pages in the report by either clicking on the pages listed below, or by using the keyword search tool below to find specific information within the annual report.-
 1
1 -
2
-
3
-
4
-
5
-
6
-
7
-
8
-
9
-
10
-
11
-
12
-
13
-
14
-
15
-
16
-
17
-
18
-
19
-
20
-
21
-
22
-
23
-
24
-
25
-
26
-
27
-
28
-
29
-
30
-
31
-
32
-
33
-
34
-
35
-
36
-
37
-
38
-
39
-
40
-
41
-
42
-
43
-
44
-
45
-
46
-
47
-
48
-
49
-
50
-
51
-
52
-
53
-
54
-
55
-
56
-
57
-
58
-
59
-
60
-
61
-
62
-
63
-
64
-
65
-
66
-
67
-
68
-
69
-
70
-
 71
71 -
 72
72 -
 73
73 -
 74
74 -
 75
75 -
 76
76 -
 77
77 -
 78
78 -
 79
79 -
 80
80 -
 81
81 -
 82
82 -
 83
83 -
 84
84 -
 85
85 -
 86
86 -
 87
87 -
 88
88 -
 89
89 -
 90
90 -
 91
91 -
92
-
93
-
94
-
95
-
96
-
97
-
98
-
99
-
100
-
101
-
102
-
103
-
104
-
105
-
106
-
107
-
108
-
109
-
110
-
111
-
112
-
113
-
114
-
115
-
116
-
117
-
118
-
119
-
120
-
121
-
122
-
123
-
124
-
125
-
126
-
127
-
128
-
129
-
130
-
131
-
132
 |
 |

75
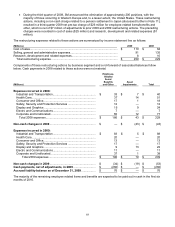
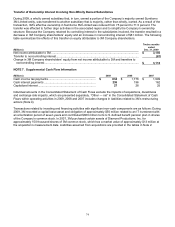
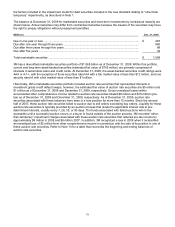
NOTE 8. Income Taxes
Income Before Income Taxes
(Millions) 2009 2008 2007
United States.................................................................................. $ 2,338 $ 2,251 $ 2,820
International.................................................................................... 2,294 2,857 3,295
Total............................................................................................ $ 4,632 $ 5,108 $ 6,115
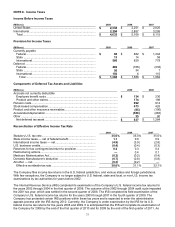
Provision for Income Taxes
(Millions) 2009 2008 2007
Currently payable
Federal........................................................................................ $88
$ 882 $ 1,344
State ........................................................................................... 13 14 58
International ................................................................................ 586 820 779
Deferred .........................................................................................
Federal........................................................................................ 489 (168) (333)
State ........................................................................................... 56 34 1
International ................................................................................ 156 6 115
Total ........................................................................................ $ 1,388 $ 1,588 $ 1,964
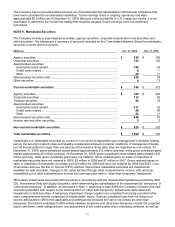
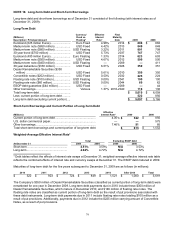
Components of Deferred Tax Assets and Liabilities
(Millions) 2009 2008
Accruals not currently deductible
Employee benefit costs .........................................................................................
.
$ 134 $ 230
Product and other claims.......................................................................................
.
174 198
Pension costs ............................................................................................................
.
692 914
Stock-based compensation.......................................................................................
.
473 425
Product and other insurance receivables..................................................................
.
(85) (100)
Accelerated depreciation...........................................................................................
.
(586) (463)
Other .........................................................................................................................
.
35 80
Net deferred tax asset ...........................................................................................
.
$ 837 $ 1,284
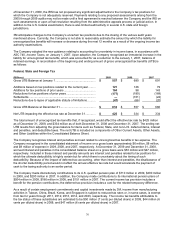
Reconciliation of Effective Income Tax Rate
2009 2008 2007
Statutory U.S. tax rate.................................................................... 35.0% 35.0% 35.0%
State income taxes — net of federal benefit .................................. 1.1 0.9 0.9
International income taxes — net................................................... (4.9) (3.9) (2.8)
U.S. business credits...................................................................... (0.4) (0.4) (0.3)
Reserves for tax contingencies/return to provision ........................ 0.4 0.3 0.4
Restructuring actions......................................................................
—
0.4 0.1
Medicare Modernization Act........................................................... (0.2) (0.2) (0.4)
Domestic Manufacturer’s deduction............................................... (0.7) (0.8) (0.8)
All other — net................................................................................ (0.3) (0.2) —
Effective worldwide tax rate........................................................ 30.0% 31.1% 32.1%
The Company files income tax returns in the U.S. federal jurisdiction, and various states and foreign jurisdictions.
With few exceptions, the Company is no longer subject to U.S. federal, state and local, or non-U.S. income tax
examinations by tax authorities for years before 2002.
The Internal Revenue Service (IRS) completed its examination of the Company’s U.S. federal income tax returns for
the years 2002 through 2004 in the first quarter of 2008. The outcome of the 2002 through 2004 audit cycle impacted
the 2001 tax year, which was settled in the second quarter of 2008. The IRS completed its field examination of the
Company’s U.S. federal income tax returns for the years 2005 through 2007 in the fourth quarter of 2009. The
Company has protested certain IRS positions within these tax years and is expected to enter the administrative
appeals process with the IRS during 2010. Currently, the Company is under examination by the IRS for its U.S.
federal income tax returns for the years 2008 and 2009. It is anticipated that the IRS will complete its examination of
the Company for 2008 by the end of the first quarter of 2010 and for 2009 by the end of the first quarter of 2011. As