3M 2009 Annual Report Download - page 89
Download and view the complete annual report
Please find page 89 of the 2009 3M annual report below. You can navigate through the pages in the report by either clicking on the pages listed below, or by using the keyword search tool below to find specific information within the annual report.-
 1
1 -
2
-
3
-
4
-
5
-
6
-
7
-
8
-
9
-
10
-
11
-
12
-
13
-
14
-
15
-
16
-
17
-
18
-
19
-
20
-
21
-
22
-
23
-
24
-
25
-
26
-
27
-
28
-
29
-
30
-
31
-
32
-
33
-
34
-
35
-
36
-
37
-
38
-
39
-
40
-
41
-
42
-
43
-
44
-
45
-
46
-
47
-
48
-
49
-
50
-
51
-
52
-
53
-
54
-
55
-
56
-
57
-
58
-
59
-
60
-
61
-
62
-
63
-
64
-
65
-
66
-
67
-
68
-
69
-
70
-
71
-
72
-
73
-
74
-
75
-
76
-
77
-
78
-
 79
79 -
 80
80 -
 81
81 -
 82
82 -
 83
83 -
 84
84 -
 85
85 -
 86
86 -
 87
87 -
 88
88 -
 89
89 -
 90
90 -
 91
91 -
 92
92 -
 93
93 -
 94
94 -
 95
95 -
 96
96 -
 97
97 -
 98
98 -
 99
99 -
100
-
101
-
102
-
103
-
104
-
105
-
106
-
107
-
108
-
109
-
110
-
111
-
112
-
113
-
114
-
115
-
116
-
117
-
118
-
119
-
120
-
121
-
122
-
123
-
124
-
125
-
126
-
127
-
128
-
129
-
130
-
131
-
132
 |
 |

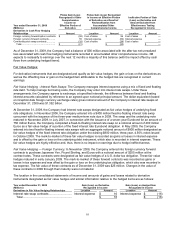
83
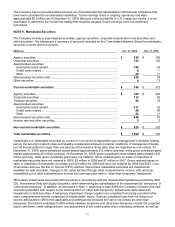
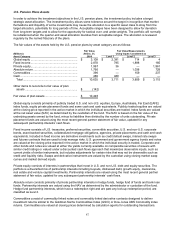
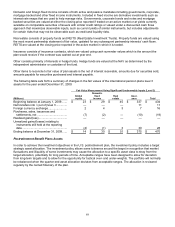
Following is a reconciliation of the beginning and ending balances of the benefit obligation and the fair value of plan
assets as of December 31:
Qualified and Non-qualified
Pension Benefits Postretirement
United States International Benefits
(Millions) 2009 2008 2009 2008 2009 2008
Change in benefit obligation............
Benefit obligation at beginning
of year ..........................................
$ 10,395 $ 10,215 $ 4,037 $ 4,856 $ 1,611 $ 1,809
Acquisitions...................................... — 22 — — — —
Service cost .....................................
183 192 98 120 51 53
Interest cost .....................................
619 597 235 252 97 100
Participant contributions .................. — —
4
5
52 56
Foreign exchange rate changes ...... — —
284 (620) 14 (20)
Plan amendments............................ — 9
14 (9) (168) (148)
Actuarial (gain) loss .........................
822 (40) 255 (369) 80 (93)
Medicare Part D Reimbursement .... — — — — 10 12
Benefit payments.............................
(649) (606) (245) (194) (168) (158)
Settlements, curtailments, special
termination benefits and other .....
21 6
3
(4) — —
Benefit obligation at end of year......
$ 11,391 $ 10,395 $ 4,685 $ 4,037 $ 1,579 $ 1,611
Change in plan assets ......................
Fair value of plan assets at
beginning of year..........................
$ 9,243 $ 11,096 $ 3,022 $ 4,424 $ 929 $ 1,355
Acquisitions...................................... — 13 — — — —
Actual return on plan assets ............
1,148 (1,495) 361 (872) 129 (377)
Company contributions....................
755 235 504 186 133 53
Participant contributions .................. — —
4
5
52 56
Foreign exchange rate changes ...... — —
251 (527) — —
Benefit payments.............................
(649) (606) (245) (194) (168) (158)
Settlements, curtailments, special
termination benefits and other .....
(4) — —
— — —
Fair value of plan assets at end
of year ..........................................
$ 10,493 $ 9,243 $ 3,897 $ 3,022 $ 1,075 $ 929
Funded status at end of year ..............
$ (898) $ (1,152) $(788) $(1,015) $ (504) $ (682)
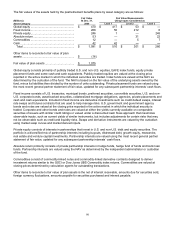
Qualified and Non-qualified
Pension Benefits Postretirement
United States International Benefits
(Millions) 2009 2008 2009 2008 2009 2008
Amounts recognized in the
Consolidated Balance Sheet as of
Dec. 31,
Non-current assets ........................... $ — $—
$78
$36
$ — $—
Accrued benefit cost .........................
Current liabilities............................ (30) (31) (7) (5) (4) (2)
Non-current liabilities .................... (868) (1,121) (859) (1,046) (500) (680)
Ending balance.................................
$ (898) $(1,152) $(788) $(1,015) $ (504) $ (682)
Amounts recognized in
accumulated other
comprehensive income as of
Dec. 31,
Net transition obligation (asset) ........ $ — $ — $ (5) $(3) $ — $—
Net actuarial loss (gain).................... 3,975 3,489 1,650 1,468 1,059 1,089
Prior service cost (credit).................. 46 62 (57) (80) (504) (416)
Ending balance.................................
$ 4,021 $ 3,551 $ 1,588 $ 1,385 $ 555 $ 673
The balance of amounts recognized for international plans in accumulated other comprehensive income as of
December 31 in the preceding table are presented based on the foreign currency exchange rate on that date.