3M 2009 Annual Report Download - page 30
Download and view the complete annual report
Please find page 30 of the 2009 3M annual report below. You can navigate through the pages in the report by either clicking on the pages listed below, or by using the keyword search tool below to find specific information within the annual report.-
 1
1 -
2
-
3
-
4
-
5
-
6
-
7
-
8
-
9
-
10
-
11
-
12
-
13
-
14
-
15
-
16
-
17
-
18
-
19
-
 20
20 -
 21
21 -
 22
22 -
 23
23 -
 24
24 -
 25
25 -
 26
26 -
 27
27 -
 28
28 -
 29
29 -
 30
30 -
 31
31 -
 32
32 -
 33
33 -
 34
34 -
 35
35 -
 36
36 -
 37
37 -
 38
38 -
 39
39 -
 40
40 -
41
-
42
-
43
-
44
-
45
-
46
-
47
-
48
-
49
-
50
-
51
-
52
-
53
-
54
-
55
-
56
-
57
-
58
-
59
-
60
-
61
-
62
-
63
-
64
-
65
-
66
-
67
-
68
-
69
-
70
-
71
-
72
-
73
-
74
-
75
-
76
-
77
-
78
-
79
-
80
-
81
-
82
-
83
-
84
-
85
-
86
-
87
-
88
-
89
-
90
-
91
-
92
-
93
-
94
-
95
-
96
-
97
-
98
-
99
-
100
-
101
-
102
-
103
-
104
-
105
-
106
-
107
-
108
-
109
-
110
-
111
-
112
-
113
-
114
-
115
-
116
-
117
-
118
-
119
-
120
-
121
-
122
-
123
-
124
-
125
-
126
-
127
-
128
-
129
-
130
-
131
-
132
 |
 |

24
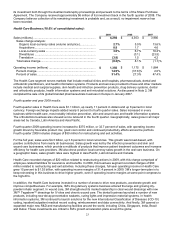
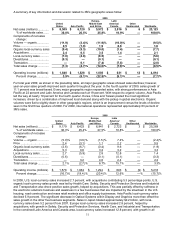
Fourth quarter and year 2008 results:
In the fourth quarter of 2008, Health Care sales topped $1 billion, despite a nearly 7 percentage point penalty from
currency translation. In local-currency terms, sales rose 4.3 percent, including 2.2 percent from acquisitions. 3M saw
solid local-currency growth in the medical products area, specifically in core infection prevention and skin and wound
care products. Geographically, the U.S. and Asia Pacific led sales growth. Operating income margins of 24.0 percent
in the fourth quarter of 2008 were the highest in the Company, which includes the impact of $50 million in
restructuring and exit activity charges that reduced operating income margins by 4.9 percentage points.
For full-year 2008, Health Care’s results were strong, with sales increasing 8.1 percent to $4.3 billion and operating
income margins of 27.3 percent. 2008 includes the impact of $60 million in restructuring and exit activities that
reduced operating income margins by 1.4 percentage points. As discussed further below, 2007 operating income
results include significant gains from the sale of 3M’s pharmaceuticals business in January 2007, negatively
impacting the 2008 versus 2007 year-on-year operating income comparison. Local-currency sales were up 6.7
percent, largely organic, but also included 1.7 percent from acquisitions. In 2008, 3M completed a number of
important bolt-on acquisitions in Health Care, including TOP-Service, a German orthodontic technology and services
company offering a digital lingual solution; Imtec, an Oklahoma-based manufacturer of dental implants and cone
beam computed tomography; and Solumed, a Quebec-based developer and marketer of leading-edge medical
products designed to prevent infections in operating rooms and hospitals. Full-year 2008 sales were led by strong
increases in 3M’s medical, dental and orthodontics businesses. Sales grew in all geographies, led by strong gains in
Asia Pacific and Latin America.
The combination of the following items positively impacted total year 2007 Health Care operating income by $791
million. As discussed in Note 2, in January 2007 the Company sold its branded pharmaceuticals business in the
Europe region. The operating income gain related to this sale, which is included in Health Care, totaled $781 million.
In addition, as discussed in Note 4, a net operating income gain of $10 million was recorded in 2007, which primarily
related to adjustments to restructuring costs incurred in the fourth quarter of 2006.
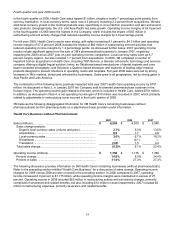
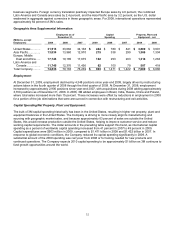
3M believes the following disaggregated information for 3M Health Care’s remaining businesses (without
pharmaceuticals) and for pharmaceuticals on a stand-alone basis provides useful information.
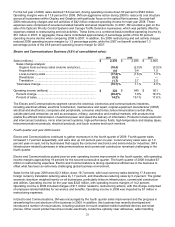
Health Care Business without Pharmaceuticals:
2009 2008 2007
Sales (millions) ............................................................................... $ 4,294 $ 4,303 $ 3,980
Sales change analysis:
Organic local-currency sales (volume and price).................... 2.7% 5.0% 13.6%
Acquisitions ............................................................................. 0.9 1.7 4.6
Local-currency sales ............................................................... 3.6% 6.7% 18.2%
Divestitures .............................................................................
—
(0.1) —
Translation .............................................................................. (3.8) 1.5 4.2
Total sales change...................................................................... (0.2)% 8.1% 22.4%
Operating income (millions) ........................................................... $ 1,350 $ 1,175 $ 1,088
Percent change........................................................................... 14.9% 8.0% 34.4%
Percent of sales .......................................................................... 31.4% 27.3% 27.3%
The following discussion provides information on 3M Health Care’s remaining businesses (without pharmaceuticals).
Refer to the preceding section entitled “Health Care Business” for a discussion of sales change. Operating income
changes for 2009 versus 2008 are also covered in the preceding section. In 2008 compared to 2007, operating
income increased 8.0 percent to $1.175 billion, while operating income margins were maintained in excess of 27
percent. Operating income in 2008 included $60 million in restructuring actions and exit activity charges, primarily
comprised of severance and related benefits, but also including $14 million in asset impairments. 2007 included $5
million in restructuring expenses, primarily severance and related benefits.