3M 2009 Annual Report Download - page 37
Download and view the complete annual report
Please find page 37 of the 2009 3M annual report below. You can navigate through the pages in the report by either clicking on the pages listed below, or by using the keyword search tool below to find specific information within the annual report.-
 1
1 -
2
-
3
-
4
-
5
-
6
-
7
-
8
-
9
-
10
-
11
-
12
-
13
-
14
-
15
-
16
-
17
-
18
-
19
-
20
-
21
-
22
-
23
-
24
-
25
-
26
-
 27
27 -
 28
28 -
 29
29 -
 30
30 -
 31
31 -
 32
32 -
 33
33 -
 34
34 -
 35
35 -
 36
36 -
 37
37 -
 38
38 -
 39
39 -
 40
40 -
 41
41 -
 42
42 -
 43
43 -
 44
44 -
 45
45 -
 46
46 -
 47
47 -
48
-
49
-
50
-
51
-
52
-
53
-
54
-
55
-
56
-
57
-
58
-
59
-
60
-
61
-
62
-
63
-
64
-
65
-
66
-
67
-
68
-
69
-
70
-
71
-
72
-
73
-
74
-
75
-
76
-
77
-
78
-
79
-
80
-
81
-
82
-
83
-
84
-
85
-
86
-
87
-
88
-
89
-
90
-
91
-
92
-
93
-
94
-
95
-
96
-
97
-
98
-
99
-
100
-
101
-
102
-
103
-
104
-
105
-
106
-
107
-
108
-
109
-
110
-
111
-
112
-
113
-
114
-
115
-
116
-
117
-
118
-
119
-
120
-
121
-
122
-
123
-
124
-
125
-
126
-
127
-
128
-
129
-
130
-
131
-
132
 |
 |

31
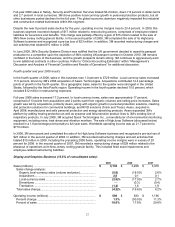
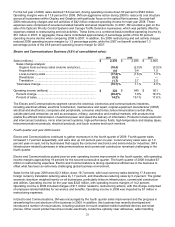
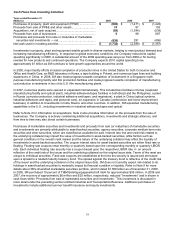
A summary of key information and discussion related to 3M’s geographic areas follow:
2009
United
States Asia Pacific
Europe,
Middle East
and Africa
Latin
America/
Canada
Other
Unallocated Worldwide
Net sales (millions) .............. $ 8,509 $ 6,120 $ 5,972 $ 2,516 $ 6 $ 23,123
% of worldwide sales ....... 36.8% 26.5% 25.8% 10.9% — 100.0%
Components of net sales
change:
Volume — organic............... (11.9) (3.4)% (11.9)% (10.0)% — (9.5)%
Price .................................... 2.5 (1.9) 1.9 8.6 — 1.8
Organic local-currency sales (9.4) (5.3) (10.0) (1.4) — (7.7)
Acquisitions ......................... 2.4 0.5 3.5 1.4 — 2.1
Local-currency sales ........... (7.0) (4.8) (6.5) — — (5.6)
Divestitures.......................... (0.3) — (0.1) — — (0.1)
Translation........................... — 0.1 (7.4) (7.6) — (2.8)
Total sales change .............. (7.3) (4.7)% (14.0)% (7.6)% — (8.5)%
Operating income (millions) $ 1,640 $ 1,528 $ 1,003 $ 631 $ 12 $ 4,814
Percent change................ 3.9% (8.1)% (22.5)% (9.1)% — (7.7)%
For total year 2009, as shown in the preceding table, all major geographic areas showed sales declines; however,
year-on-year sales growth improved each quarter throughout the year. In the fourth quarter of 2009, sales growth of
11.1 percent was broad-based. Every major geographic region expanded sales, with strong performances in Asia
Pacific at 22 percent and Latin America and Canada each at 19 percent. With respect to organic volume, Asia Pacific
led the way at nearly 19 percent for the fourth quarter. Korea, China and Taiwan posted the most significant
increases, driven by a combination of improved local demand along with the pickup in global electronics. Organic
volumes were flat to slightly down in other geographic regions, which is an improvement versus the levels of decline
seen in the first three quarters of 2009. For 2009, international operations represented approximately 63 percent of
3M’s sales.
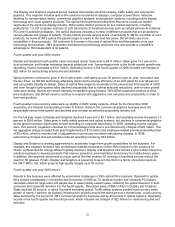
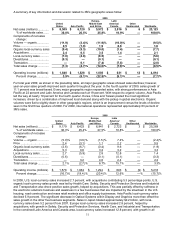
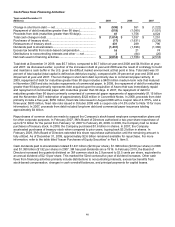
2008
United
States Asia Pacific
Europe,
Middle East
and Africa
Latin
America/
Canada
Other
Unallocated Worldwide
Net sales (millions).............. $ 9,179 $ 6,423 $ 6,941
$
2,723 $ 3 $ 25,269
% of worldwide sales ....... 36.3% 25.4% 27.5% 10.8% — 100.0%
Components of net sales
change:
Volume — organic............... (5.0)% (3.6)% (1.5 )% 7.4% — (2.4)%
Price .................................... 2.4 (3.1) 1.1 2.2 — 0.5
Organic local-currency sales (2.6) (6.7) (0.4) 9.6 — (1.9)
Acquisitions ......................... 5.3 0.8 3.2 3.2 — 3.3
Local-currency sales ........... 2.7 (5.9) 2.8 12.8 — 1.4
Divestitures.......................... (0.6) — (0.1) (0.1) — (0.3)
Translation........................... — 3.2 4.0 2.4 — 2.2
Total sales change .............. 2.1% (2.7)% 6.7% 15.1% — 3.3%
Operating income (millions) $ 1,578 $ 1,662 $ 1,294
$
693 $ (9) $ 5,218
Percent change................ (16.7)% (19.4 )% (20.4 )% 12.6% —% (15.7)%
In 2008, U.S. local-currency sales increased 2.7 percent, with acquisitions contributing 5.3 percentage points. U.S.
organic local-currency sales growth was led by Health Care. Safety, Security and Protection Services and Industrial
and Transportation also drove positive sales growth, helped by acquisitions. This was partially offset by softness in
the electronic solutions business and weakness in a few businesses that are impacted by the slowdown in the U.S.
housing, road construction and mass retail markets and office supply businesses. Asia Pacific local-currency sales
declined 5.9 percent. The significant decrease in Optical Systems within Display and Graphics more than offset the
sales growth in the other five business segments. Sales in Japan totaled approximately $2.2 billion, with local-
currency sales down 5.2 percent from 2007. Europe local-currency sales increased 2.8 percent, helped by
acquisitions, with growth in Safety, Security and Protection Services, Health Care, and Industrial and Transportation.
In the combined Latin America and Canada area, local-currency sales increased 12.8 percent, with growth in all