3M 2009 Annual Report Download - page 74
Download and view the complete annual report
Please find page 74 of the 2009 3M annual report below. You can navigate through the pages in the report by either clicking on the pages listed below, or by using the keyword search tool below to find specific information within the annual report.-
 1
1 -
2
-
3
-
4
-
5
-
6
-
7
-
8
-
9
-
10
-
11
-
12
-
13
-
14
-
15
-
16
-
17
-
18
-
19
-
20
-
21
-
22
-
23
-
24
-
25
-
26
-
27
-
28
-
29
-
30
-
31
-
32
-
33
-
34
-
35
-
36
-
37
-
38
-
39
-
40
-
41
-
42
-
43
-
44
-
45
-
46
-
47
-
48
-
49
-
50
-
51
-
52
-
53
-
54
-
55
-
56
-
57
-
58
-
59
-
60
-
61
-
62
-
63
-
 64
64 -
 65
65 -
 66
66 -
 67
67 -
 68
68 -
 69
69 -
 70
70 -
 71
71 -
 72
72 -
 73
73 -
 74
74 -
 75
75 -
 76
76 -
 77
77 -
 78
78 -
 79
79 -
 80
80 -
 81
81 -
 82
82 -
 83
83 -
 84
84 -
85
-
86
-
87
-
88
-
89
-
90
-
91
-
92
-
93
-
94
-
95
-
96
-
97
-
98
-
99
-
100
-
101
-
102
-
103
-
104
-
105
-
106
-
107
-
108
-
109
-
110
-
111
-
112
-
113
-
114
-
115
-
116
-
117
-
118
-
119
-
120
-
121
-
122
-
123
-
124
-
125
-
126
-
127
-
128
-
129
-
130
-
131
-
132
 |
 |

68
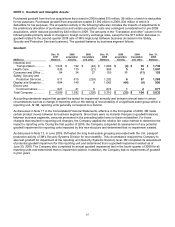
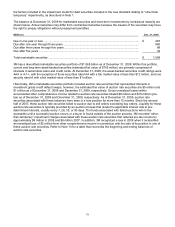
• During the third quarter of 2009, 3M announced the elimination of approximately 200 positions, with the
majority of those occurring in Western Europe and, to a lesser extent, the United States. These restructuring
actions, including a non-cash charge related to a pension settlement in Japan (discussed further in Note 11),
resulted in a third-quarter 2009 net pre-tax charge of $26 million for employee-related items/benefits and
other, which is net of $7 million of adjustments to prior 2008 and 2009 restructuring actions. The preceding
charges were recorded in cost of sales ($25 million) and research, development and related expenses ($1
million).
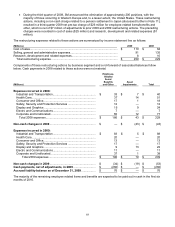
The restructuring expenses related to these actions are summarized by income statement line as follows:
(Millions) 2009 2008
Cost of sales..............................................................................................................
.
$ 110 $ 84
Selling, general and administrative expenses...........................................................
.
91 135
Research, development and related expenses.........................................................
.
8 10
Total restructuring expense ...................................................................................
.
$ 209 $ 229
Components of these restructuring actions by business segment and a roll-forward of associated balances follow
below. Cash payments in 2008 related to these actions were not material.
(Millions)
Employee-
Related
Items/
Benefits
and Other
Asset
Impairments Total
Expenses incurred in 2008:
Industrial and Transportation...................................................... $ 33 $ 7 $ 40
Health Care................................................................................. 37 14 51
Consumer and Office.................................................................. 17 1 18
Safety, Security and Protection Services ................................... 12 — 12
Display and Graphics ................................................................. 15 9 24
Electro and Communications...................................................... 7 — 7
Corporate and Unallocated......................................................... 65 12 77
Total 2008 expenses............................................................... $ 186 $ 43 $ 229
Non-cash changes in 2008 .......................................................... $ — $ (43) $ (43)
Expenses incurred in 2009:
Industrial and Transportation...................................................... $ 83 $ 5 $ 88
Health Care................................................................................. 20 — 20
Consumer and Office.................................................................. 13 — 13
Safety, Security and Protection Services ................................... 17 — 17
Display and Graphics ................................................................. 9 13 22
Electro and Communications...................................................... 11 — 11
Corporate and Unallocated......................................................... 37 1 38
Total 2009 expenses ........................................................... $ 190 $ 19 $ 209
Non-cash changes in 2009 .......................................................... $ (34) $ (19) $ (53)
Cash payments, net of adjustments, in 2009 ............................ $ (266) $ — $ (266)
Accrued liability balance as of December 31, 2009.................. $ 76 $ — $ 76
The majority of the remaining employee related items and benefits are expected to be paid out in cash in the first six
months of 2010.