3M 2009 Annual Report Download - page 93
Download and view the complete annual report
Please find page 93 of the 2009 3M annual report below. You can navigate through the pages in the report by either clicking on the pages listed below, or by using the keyword search tool below to find specific information within the annual report.-
 1
1 -
2
-
3
-
4
-
5
-
6
-
7
-
8
-
9
-
10
-
11
-
12
-
13
-
14
-
15
-
16
-
17
-
18
-
19
-
20
-
21
-
22
-
23
-
24
-
25
-
26
-
27
-
28
-
29
-
30
-
31
-
32
-
33
-
34
-
35
-
36
-
37
-
38
-
39
-
40
-
41
-
42
-
43
-
44
-
45
-
46
-
47
-
48
-
49
-
50
-
51
-
52
-
53
-
54
-
55
-
56
-
57
-
58
-
59
-
60
-
61
-
62
-
63
-
64
-
65
-
66
-
67
-
68
-
69
-
70
-
71
-
72
-
73
-
74
-
75
-
76
-
77
-
78
-
79
-
80
-
81
-
82
-
 83
83 -
 84
84 -
 85
85 -
 86
86 -
 87
87 -
 88
88 -
 89
89 -
 90
90 -
 91
91 -
 92
92 -
 93
93 -
 94
94 -
 95
95 -
 96
96 -
 97
97 -
 98
98 -
 99
99 -
 100
100 -
 101
101 -
 102
102 -
 103
103 -
104
-
105
-
106
-
107
-
108
-
109
-
110
-
111
-
112
-
113
-
114
-
115
-
116
-
117
-
118
-
119
-
120
-
121
-
122
-
123
-
124
-
125
-
126
-
127
-
128
-
129
-
130
-
131
-
132
 |
 |

87
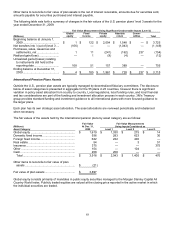
U.S. Pension Plans Assets
In order to achieve the investment objectives in the U.S. pension plans, the investment policy includes a target
strategic asset allocation. The investment policy allows some tolerance around the target in recognition that market
fluctuations and illiquidity of some investments may cause the allocation to a specific asset class to stray from the
target allocation, potentially for long periods of time. Acceptable ranges have been designed to allow for deviation
from long-term targets and to allow for the opportunity for tactical over- and under-weights. The portfolio will normally
be rebalanced when the quarter-end asset allocation deviates from acceptable ranges. The allocation is reviewed
regularly by the named fiduciary of the plans.
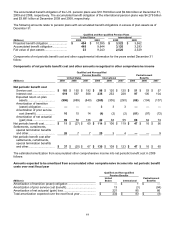
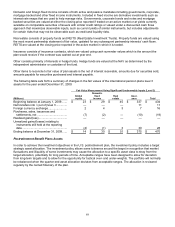
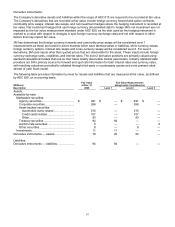
The fair values of the assets held by the U.S. pension plans by asset category are as follows:
(Millions)
Fair Value
At Dec. 31,
Fair Value Measurements
Using Inputs Considered as
Asset Category 2009 Level 1 Level 2 Level 3
Global equity ........................................................... $ 3,109 $ 2,391 $ 714 $4
Fixed income ........................................................... 2,878 795 1,898 185
Private equity........................................................... 1,997 36 — 1,961
Absolute return ........................................................ 1,766
—
1,038 728
Commodities ........................................................... 396
—
159 237
Cash ........................................................................ 489 489 — —
Total..................................................................... $ 10,635 $ 3,711 $ 3,809 $ 3,115
Other items to reconcile to fair value of plan
assets .................................................................. $ (142)
Fair value of plan assets ......................................... $ 10,493
Global equity consists primarily of publicly traded U.S. and non-U.S. equities, Europe, Australasia, Far East (EAFE)
index funds, equity private placement funds and some cash and cash equivalents. Publicly traded equities are valued
at the closing price reported in the active market in which the individual securities are traded. Index funds are valued
at the net asset value (NAV) as determined by the custodian of the fund. The NAV is based on the fair value of the
underlying assets owned by the fund, minus its liabilities then divided by the number of units outstanding. Private
placement funds are valued using the most recent general partner statement of fair value, updated for any
subsequent partnership interests’ cash flows.
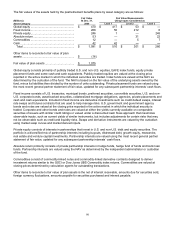
Fixed income consists of U.S. treasuries, preferred securities, convertible securities, U.S. and non-U.S. corporate
bonds, asset backed securities, collateralized mortgage obligations, agencies, private placements and cash and cash
equivalents. Included in fixed income are derivative investments such as credit default swaps, interest rate swaps
and futures contracts that are used to help manage risks. U.S. government and government agency bonds and notes
are valued at the closing price reported in the active market in which the individual security is traded. Corporate and
other bonds and notes are valued at either the yields currently available on comparable securities of issuers with
similar credit ratings or valued under a discounted cash flows approach that maximizes observable inputs, such as
current yields of similar instruments, but includes adjustments for certain risks that may not be observable such as
credit and liquidity risks. Swaps and derivative instruments are valued by the custodian using closing market swap
curves and market derived inputs.
Private equity consists of interests in partnerships that invest in U.S. and non-U.S. debt and equity securities. The
portfolio is a diversified mix of partnership interests including buyouts, distressed debt, growth equity, mezzanine,
real estate and venture capital investments. Partnership interests are valued using the most recent general partner
statement of fair value, updated for any subsequent partnership interests’ cash flows.
Absolute return consists primarily of private partnership interests in hedge funds, hedge fund of funds and bank loan
funds. Partnership interests are valued using the NAV as determined by the administrator or custodian of the fund.
Hedge fund partnership interests, which have a redemption right and are past any lock-up redemption period, are
classified as level 2.
Commodities consist of commodity-linked notes and commodity-linked derivative contracts designed to deliver
investment returns similar to the Goldman Sachs Commodities Index (GSCI) or Dow Jones UBS Commodity index
returns. Commodities are valued at closing prices determined by calculation agents for outstanding transactions.