3M 2009 Annual Report Download - page 46
Download and view the complete annual report
Please find page 46 of the 2009 3M annual report below. You can navigate through the pages in the report by either clicking on the pages listed below, or by using the keyword search tool below to find specific information within the annual report.-
 1
1 -
2
-
3
-
4
-
5
-
6
-
7
-
8
-
9
-
10
-
11
-
12
-
13
-
14
-
15
-
16
-
17
-
18
-
19
-
20
-
21
-
22
-
23
-
24
-
25
-
26
-
27
-
28
-
29
-
30
-
31
-
32
-
33
-
34
-
35
-
 36
36 -
 37
37 -
 38
38 -
 39
39 -
 40
40 -
 41
41 -
 42
42 -
 43
43 -
 44
44 -
 45
45 -
 46
46 -
 47
47 -
 48
48 -
 49
49 -
 50
50 -
 51
51 -
 52
52 -
 53
53 -
 54
54 -
 55
55 -
 56
56 -
57
-
58
-
59
-
60
-
61
-
62
-
63
-
64
-
65
-
66
-
67
-
68
-
69
-
70
-
71
-
72
-
73
-
74
-
75
-
76
-
77
-
78
-
79
-
80
-
81
-
82
-
83
-
84
-
85
-
86
-
87
-
88
-
89
-
90
-
91
-
92
-
93
-
94
-
95
-
96
-
97
-
98
-
99
-
100
-
101
-
102
-
103
-
104
-
105
-
106
-
107
-
108
-
109
-
110
-
111
-
112
-
113
-
114
-
115
-
116
-
117
-
118
-
119
-
120
-
121
-
122
-
123
-
124
-
125
-
126
-
127
-
128
-
129
-
130
-
131
-
132
 |
 |

40
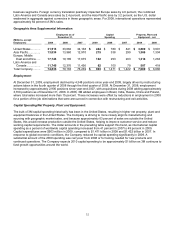
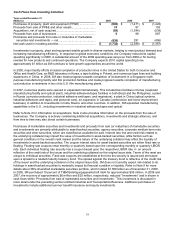
Cash Flows from Financing Activities:
Years ended December 31
(Millions) 2009 2008 2007
Change in short-term debt — net................................................... $ (536) $ 361 $ (1,222)
Repayment of debt (maturities greater than 90 days).................... (519) (1,080) (1,551)
Proceeds from debt (maturities greater than 90 days)................... 41 1,756 4,024
Total cash change in debt .............................................................. $ (1,014) $ 1,037 $ 1,251
Purchases of treasury stock........................................................... (17) (1,631) (3,239)
Reissuances of treasury stock ....................................................... 431 289 796
Dividends paid to shareholders...................................................... (1,431) (1,398) (1,380)
Excess tax benefits from stock-based compensation .................... 14 21 74
Distributions to noncontrolling interests and other — net .............. 3
(84) (20)
Net cash used in financing activities .............................................. $ (2,014) $ (1,766) $ (2,518)
Total debt at December 31 2009, was $5.7 billion, compared to $6.7 billion at year-end 2008 and $4.9 billion at year-
end 2007. As discussed earlier, a portion of the increase in debt at year-end 2008 was the result of a strategy to build
and maintain a cash buffer in the U.S. given the difficult market environment at that point in time. Total debt was 30
percent of total capital (total capital is defined as debt plus equity), compared with 39 percent at year-end 2008 and
29 percent at year-end 2007. The net change in short-term debt is primarily due to commercial paper activity. In
2009, repayment of debt for maturities greater than 90 days includes a $400 million medium-term note that matured
in November 2009 and also includes repayments of commercial paper. In 2008, the repayment of debt for maturities
greater than 90 days primarily represents debt acquired upon the acquisition of Aearo that was immediately repaid
and repayment of commercial paper with maturities greater than 90 days. In 2007, the repayment of debt for
maturities greater than 90 days is primarily comprised of commercial paper repayments of approximately $1.15 billion
and the November 2007 redemption of approximately $322 million in Convertible Notes. In 2008, proceeds from debt
primarily include a five-year, $850 million, fixed rate note issued in August 2008 with a coupon rate of 4.375%, and a
three-year, $800 million, fixed rate note issued in October 2008 with a coupon rate of 4.5% (refer to Note 10 for more
information). In 2007, proceeds from debt included long-term debt and commercial paper issuances totaling
approximately $4 billion.
Repurchases of common stock are made to support the Company’s stock-based employee compensation plans and
for other corporate purposes. In February 2007, 3M’s Board of Directors authorized a two-year share repurchase of
up to $7.0 billion for the period from February 12, 2007 to February 28, 2009. In 2009, the Company had no broker
purchases of treasury stock. In 2008, the Company purchased $1.6 billion in shares. In 2007, the Company
accelerated purchases of treasury stock when compared to prior years, buying back $3.2 billion in shares. In
February 2009, 3M’s Board of Directors extended this share repurchase authorization until the remaining amount is
fully utilized. As of December 31, 2009, approximately $2.6 billion remained available for repurchase. For more
information, refer to the table titled “Issuer Purchases of Equity Securities” in Part II, Item 5.
Cash dividends paid to shareholders totaled $1.431 billion ($2.04 per share), $1.398 billion ($2.00 per share) in 2008
and $1.380 billion ($1.92 per share) in 2007. 3M has paid dividends since 1916. In February 2010, the Board of
Directors increased the quarterly dividend on 3M common stock by 2.9 percent to 52.5 cents per share, equivalent to
an annual dividend of $2.10 per share. This marked the 52nd consecutive year of dividend increases. Other cash
flows from financing activities primarily include distributions to noncontrolling interests, excess tax benefits from
stock-based compensation, changes in cash overdraft balances, and principal payments for capital leases.