eBay 2013 Annual Report Download - page 99
Download and view the complete annual report
Please find page 99 of the 2013 eBay annual report below. You can navigate through the pages in the report by either clicking on the pages listed below, or by using the keyword search tool below to find specific information within the annual report.-
 1
1 -
2
-
3
-
4
-
5
-
6
-
7
-
8
-
9
-
10
-
11
-
12
-
13
-
14
-
15
-
16
-
17
-
18
-
19
-
20
-
21
-
22
-
23
-
24
-
25
-
26
-
27
-
28
-
29
-
30
-
31
-
32
-
33
-
34
-
35
-
36
-
37
-
38
-
39
-
40
-
41
-
42
-
43
-
44
-
45
-
46
-
47
-
48
-
49
-
50
-
51
-
52
-
53
-
54
-
55
-
56
-
57
-
58
-
59
-
60
-
61
-
62
-
63
-
64
-
65
-
66
-
67
-
68
-
69
-
70
-
71
-
72
-
73
-
74
-
75
-
76
-
77
-
78
-
79
-
80
-
81
-
82
-
83
-
84
-
85
-
86
-
87
-
88
-
 89
89 -
 90
90 -
 91
91 -
 92
92 -
 93
93 -
 94
94 -
 95
95 -
 96
96 -
 97
97 -
 98
98 -
 99
99 -
 100
100 -
 101
101 -
 102
102 -
 103
103 -
 104
104 -
 105
105 -
 106
106 -
 107
107 -
 108
108 -
 109
109 -
110
-
111
-
112
-
113
-
114
-
115
-
116
-
117
-
118
-
119
-
120
-
121
-
122
-
123
-
124
-
125
-
126
-
127
-
128
-
129
-
130
-
131
-
132
-
133
-
134
-
135
-
136
-
137
-
138
-
139
-
140
-
141
-
142
-
143
-
144
-
145
-
146
-
147
-
148
-
149
-
150
-
151
-
152
-
153
-
154
-
155
-
156
-
157
-
158
-
159
-
160
-
161
-
162
-
163
-
164
-
165
-
166
-
167
 |
 |

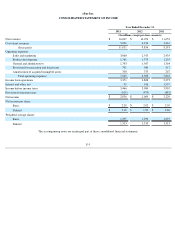
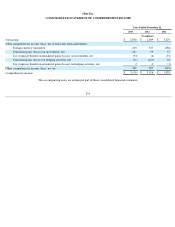
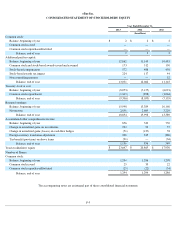
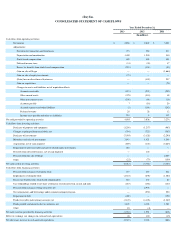
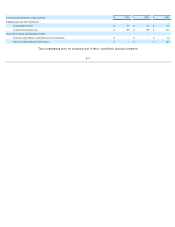
eBay Inc.
CONSOLIDATED STATEMENT OF INCOME
The accompanying notes are an integral part of these consolidated financial statements.
F-3
Year Ended December 31,
2013
2012
2011
(In millions, except per share amounts)
Net revenues
$
16,047
$
14,072
$
11,652
Cost of net revenues
5,036
4,216
3,461
Gross profit
11,011
9,856
8,191
Operating expenses:
Sales and marketing
3,060
2,913
2,435
Product development
1,768
1,573
1,235
General and administrative
1,703
1,567
1,364
Provision for transaction and loan losses
791
580
517
Amortization of acquired intangible assets
318
335
267
Total operating expenses
7,640
6,968
5,818
Income from operations
3,371
2,888
2,373
Interest and other, net
95
196
1,537
Income before income taxes
3,466
3,084
3,910
Provision for income taxes
(610
)
(475
)
(681
)
Net income
$
2,856
$
2,609
$
3,229
Net income per share:
Basic
$
2.20
$
2.02
$
2.50
Diluted
$
2.18
$
1.99
$
2.46
Weighted average shares:
Basic
1,295
1,292
1,293
Diluted
1,313
1,313
1,313