eBay 2013 Annual Report Download - page 125
Download and view the complete annual report
Please find page 125 of the 2013 eBay annual report below. You can navigate through the pages in the report by either clicking on the pages listed below, or by using the keyword search tool below to find specific information within the annual report.-
 1
1 -
2
-
3
-
4
-
5
-
6
-
7
-
8
-
9
-
10
-
11
-
12
-
13
-
14
-
15
-
16
-
17
-
18
-
19
-
20
-
21
-
22
-
23
-
24
-
25
-
26
-
27
-
28
-
29
-
30
-
31
-
32
-
33
-
34
-
35
-
36
-
37
-
38
-
39
-
40
-
41
-
42
-
43
-
44
-
45
-
46
-
47
-
48
-
49
-
50
-
51
-
52
-
53
-
54
-
55
-
56
-
57
-
58
-
59
-
60
-
61
-
62
-
63
-
64
-
65
-
66
-
67
-
68
-
69
-
70
-
71
-
72
-
73
-
74
-
75
-
76
-
77
-
78
-
79
-
80
-
81
-
82
-
83
-
84
-
85
-
86
-
87
-
88
-
89
-
90
-
91
-
92
-
93
-
94
-
95
-
96
-
97
-
98
-
99
-
100
-
101
-
102
-
103
-
104
-
105
-
106
-
107
-
108
-
109
-
110
-
111
-
112
-
113
-
114
-
 115
115 -
 116
116 -
 117
117 -
 118
118 -
 119
119 -
 120
120 -
 121
121 -
 122
122 -
 123
123 -
 124
124 -
 125
125 -
 126
126 -
 127
127 -
 128
128 -
 129
129 -
 130
130 -
 131
131 -
 132
132 -
 133
133 -
 134
134 -
 135
135 -
136
-
137
-
138
-
139
-
140
-
141
-
142
-
143
-
144
-
145
-
146
-
147
-
148
-
149
-
150
-
151
-
152
-
153
-
154
-
155
-
156
-
157
-
158
-
159
-
160
-
161
-
162
-
163
-
164
-
165
-
166
-
167
 |
 |

eBay Inc.
NOTES TO CONSOLIDATED FINANCIAL STATEMENTS—(Continued)
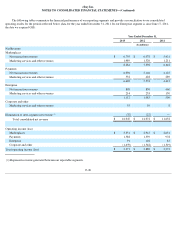
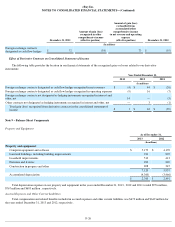
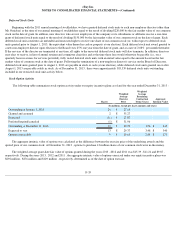
Effect of Derivative Contracts on Consolidated Statement of Income
The following table provides the location in our financial statements of the recognized gains or losses related to our derivative
instruments:
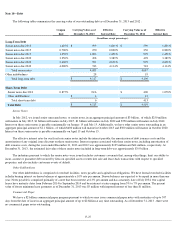
Note 9 – Balance Sheet Components
Property and Equipment
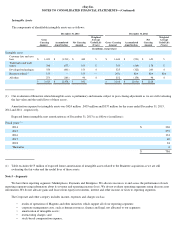
Total depreciation expense on our property and equipment in the years ended December 31, 2013 , 2012 and 2011 totaled $976 million ,
$767 million and $603 million , respectively.
Accrued Expenses and Other Current Liabilities
Total compensation and related benefits included in accrued expenses and other current liabilities was $672 million and $649 million for
the years ended December 31, 2013 and 2012, respectively.
F-26
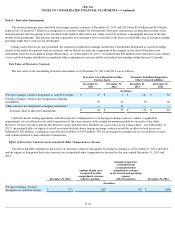
December 31, 2011
Amount of gain (loss)
recognized in other
comprehensive income
(effective portion)
Amount of gain (loss)
reclassified from
accumulated other
comprehensive income
to net revenue and operating
expense
(effective portion)
December 31, 2012
(In millions)
Foreign exchange contracts
designated as cash flow hedges
$
72
(54
)
73
$
(55
)
Year Ended December 31,
2013
2012
2011
(In millions)
Foreign exchange contracts designated as cash flow hedges recognized in net revenues
$
(4
)
$
44
$
(26
)
Foreign exchange contracts designated as cash flow hedges recognized in operating expenses
(9
)
16
(7
)
Foreign exchange contracts not designated as hedging instruments recognized in interest and
other, net
14
—
(
5
)
Other contracts not designated as hedging instruments recognized in interest and other, net
—
3
(1
)
Total gain (loss) recognized from derivative contracts in the consolidated statement of
income
$
1
$
63
$
(39
)
As of December 31,
2013
2012
(In millions)
Property and equipment:
Computer equipment and software
$
5,179
$
4,170
Land and buildings, including building improvements
931
807
Leasehold improvements
512
413
Furniture and fixtures
290
220
Construction in progress and other
208
347
7,120
5,957
Accumulated depreciation
(4,360
)
(3,466
)
$
2,760
$
2,491