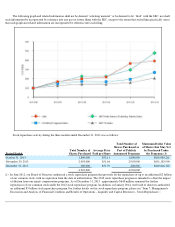
eBay 2013 Annual Report Download - page 67
Download and view the complete annual report
Please find page 67 of the 2013 eBay annual report below. You can navigate through the pages in the report by either clicking on the pages listed below, or by using the keyword search tool below to find specific information within the annual report.-
 1
1 -
2
-
3
-
4
-
5
-
6
-
7
-
8
-
9
-
10
-
11
-
12
-
13
-
14
-
15
-
16
-
17
-
18
-
19
-
20
-
21
-
22
-
23
-
24
-
25
-
26
-
27
-
28
-
29
-
30
-
31
-
32
-
33
-
34
-
35
-
36
-
37
-
38
-
39
-
40
-
41
-
42
-
43
-
44
-
45
-
46
-
47
-
48
-
49
-
50
-
51
-
52
-
53
-
54
-
55
-
56
-
 57
57 -
 58
58 -
 59
59 -
 60
60 -
 61
61 -
 62
62 -
 63
63 -
 64
64 -
 65
65 -
 66
66 -
 67
67 -
 68
68 -
 69
69 -
 70
70 -
 71
71 -
 72
72 -
 73
73 -
 74
74 -
 75
75 -
 76
76 -
 77
77 -
78
-
79
-
80
-
81
-
82
-
83
-
84
-
85
-
86
-
87
-
88
-
89
-
90
-
91
-
92
-
93
-
94
-
95
-
96
-
97
-
98
-
99
-
100
-
101
-
102
-
103
-
104
-
105
-
106
-
107
-
108
-
109
-
110
-
111
-
112
-
113
-
114
-
115
-
116
-
117
-
118
-
119
-
120
-
121
-
122
-
123
-
124
-
125
-
126
-
127
-
128
-
129
-
130
-
131
-
132
-
133
-
134
-
135
-
136
-
137
-
138
-
139
-
140
-
141
-
142
-
143
-
144
-
145
-
146
-
147
-
148
-
149
-
150
-
151
-
152
-
153
-
154
-
155
-
156
-
157
-
158
-
159
-
160
-
161
-
162
-
163
-
164
-
165
-
166
-
167
 |
 |

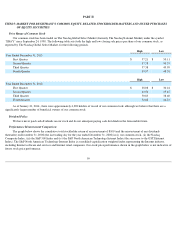
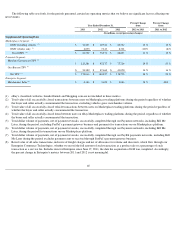
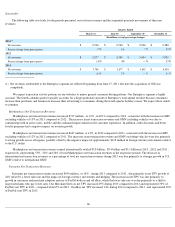
The following table sets forth the breakdown of net revenues by type and geography for the periods presented.
Revenues are attributed to U.S. and international geographies based primarily upon the country in which the seller, payment recipient,
customer, website that displays advertising, or other service provider, as the case may be, is located.
Because we generated a majority of our net revenues internationally in recent periods, including the years ended December 31, 2013 ,
2012 and 2011 , we are subject to the risks of doing business in foreign countries as discussed under “Item 1A: Risk Factors.” In that regard,
fluctuations in foreign currency exchange rates impact our results of operations. We have a foreign exchange risk management program that is
designed to reduce our exposure to fluctuations in foreign currencies; however, the effectiveness of this program in mitigating the impact of
foreign currency fluctuations on our results of operations varies from period to period, and in any given period, our operating results are usually
affected, sometimes significantly, by changes in currency exchange rates. Fluctuations in exchange rates also directly affect our cross-border
revenue. We calculate the year-over-year impact of foreign currency movements on our business using prior period foreign currency rates
applied to current year transactional currency amounts.
For the year ended December 31, 2013 , foreign currency movements relative to the U.S. dollar positively impacted net revenues by
approximately $24 million (inclusive of a $4 million negative impact from hedging activities relating to PayPal's net revenue) compared to the
prior year. Foreign currency movements relative to the U.S. dollar for the year ended December 31, 2013 positively impacted Marketplaces net
revenues by approximately $36 million and negatively impacted Payments and Enterprise net revenues by approximately $11 million and less
than $1 million, respectively, compared to the prior year (inclusive of the impact of hedging activities, noted above, in the case of Payments net
revenues).
For the year ended December 31, 2012, foreign currency movements relative to the U.S. dollar negatively impacted net revenues by
approximately $206 million (inclusive of a $44 million positive impact from hedging activities relating to PayPal's net revenue) compared to the
prior year. Foreign currency movements relative to the U.S. dollar for the year ended December 31, 2012 negatively impacted Marketplaces,
Payments, and Enterprise net revenues by approximately $172 million, $33 million and $1 million, respectively, compared to the prior year
(inclusive of the impact of hedging activities, noted above, in the case of Payments net revenues).
Year Ended December 31,
2013
2012
2011
(1)
(In millions, except percentage changes)
Net Revenues by Type:
Net transaction revenues
Marketplaces
$
6,795
$
6,078
$
5,431
Payments
6,096
5,146
4,123
Enterprise
898
850
460
Total net transaction revenues
13,789
12,074
10,014
Marketing services and other revenues
Marketplaces
1,489
1,320
1,211
Payments
532
428
289
Enterprise
214
233
130
Corporate and other
55
39
8
Total marketing services and other revenues
2,290
2,020
1,638
Elimination of inter-segment net revenue
(2)
(32
)
(22
)
—
Total net revenues
$
16,047
$
14,072
$
11,652
Net Revenues by Geography:
U.S.
$
7,712
$
6,778
$
5,484
International
8,335
7,294
6,168
Total net revenues
$
16,047
$
14,072
$
11,652
(1)
Includes data for Enterprise since June 17, 2011, the date the acquisition of GSI was completed.
(2)
Represents net revenue generated between our reportable segments.