eBay 2013 Annual Report Download - page 77
Download and view the complete annual report
Please find page 77 of the 2013 eBay annual report below. You can navigate through the pages in the report by either clicking on the pages listed below, or by using the keyword search tool below to find specific information within the annual report.-
 1
1 -
2
-
3
-
4
-
5
-
6
-
7
-
8
-
9
-
10
-
11
-
12
-
13
-
14
-
15
-
16
-
17
-
18
-
19
-
20
-
21
-
22
-
23
-
24
-
25
-
26
-
27
-
28
-
29
-
30
-
31
-
32
-
33
-
34
-
35
-
36
-
37
-
38
-
39
-
40
-
41
-
42
-
43
-
44
-
45
-
46
-
47
-
48
-
49
-
50
-
51
-
52
-
53
-
54
-
55
-
56
-
57
-
58
-
59
-
60
-
61
-
62
-
63
-
64
-
65
-
66
-
 67
67 -
 68
68 -
 69
69 -
 70
70 -
 71
71 -
 72
72 -
 73
73 -
 74
74 -
 75
75 -
 76
76 -
 77
77 -
 78
78 -
 79
79 -
 80
80 -
 81
81 -
 82
82 -
 83
83 -
 84
84 -
 85
85 -
 86
86 -
 87
87 -
88
-
89
-
90
-
91
-
92
-
93
-
94
-
95
-
96
-
97
-
98
-
99
-
100
-
101
-
102
-
103
-
104
-
105
-
106
-
107
-
108
-
109
-
110
-
111
-
112
-
113
-
114
-
115
-
116
-
117
-
118
-
119
-
120
-
121
-
122
-
123
-
124
-
125
-
126
-
127
-
128
-
129
-
130
-
131
-
132
-
133
-
134
-
135
-
136
-
137
-
138
-
139
-
140
-
141
-
142
-
143
-
144
-
145
-
146
-
147
-
148
-
149
-
150
-
151
-
152
-
153
-
154
-
155
-
156
-
157
-
158
-
159
-
160
-
161
-
162
-
163
-
164
-
165
-
166
-
167
 |
 |

indefinitely in our foreign subsidiaries. If these earnings were distributed into the U.S. in the form of dividends to eBay companies domiciled in
the U.S. or otherwise, or if the shares of the relevant foreign subsidiaries were sold or otherwise transferred, we would be subject to additional
U.S. income taxes (subject to an adjustment for foreign tax credits) and foreign withholding taxes. Further, as a result of certain of our ongoing
employment and capital investment actions and commitments, our income in certain countries including Switzerland, Singapore and
Luxembourg, is subject to reduced tax rates. Our failure to meet these commitments could adversely impact our provision for income taxes.
Additionally, please see the information in "Item 1A: Risk Factors" under the caption "We may have exposure to greater than anticipated tax
liabilities."
From time to time, we engage in certain intercompany transactions and legal entity restructurings. We consider many factors when
evaluating these transactions, including the alignment of our corporate structure with our organizational objectives and the operational and tax
efficiency of our corporate structure, as well as the long-term cash flows and cash needs of our different businesses. These transactions may
impact our overall tax rate and/or result in additional cash tax payments. The impact in any period may be significant. These transactions may be
complex and the impact of such transactions on future periods may be difficult to estimate.
We are regularly under examination by tax authorities both domestically and internationally. We believe that adequate amounts have been
reserved for any adjustments that may ultimately result from these examinations, although we cannot assure you that this will be the case given
the inherent uncertainties in these examinations. Due to the ongoing tax examinations, we believe it is impractical to determine the amount and
timing of these adjustments.
Liquidity and Capital Resources
Cash Flows
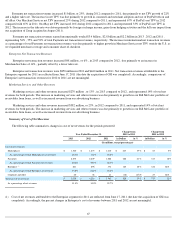
Operating Activities
We generated cash from operating activities of $5.0 billion , $3.8 billion and $3.3 billion in 2013 , 2012 and 2011 , respectively. The
increase in cash provided by operating activities in 2013 as compared to 2012 is due primarily to higher net income driven by higher revenues,
increases in non-cash charges to net income related to our provision for transaction and loan losses and depreciation and amortization and lower
cash paid for income taxes.
The increase in cash provided by operating activities in 2012 compared to 2011 was due primarily to higher income from operations
resulting from growth in revenues.
Cash paid for income taxes in 2013 , 2012 and 2011 was $466 million , $789 million and $373 million , respectively.
Investing Activities
The net cash used in investing activities of $6.0 billion in 2013 was due primarily to net cash paid for purchases of investments of $7.5
billion , purchases of property and equipment of $1.3 billion and the purchase of consumer loan receivables (net of collections and charge-offs)
originated through our Bill Me Later merchant network of $794 million , partially offset by proceeds of $3.9 billion for sales of investments.
The net cash used in investing activities of $3.8 billion in 2012 was due primarily to net cash paid for purchases of investments of $3.1
billion, purchases of property and equipment, of $1.3 billion and the purchase of consumer loan receivables (net of collections) originated
through our Bill Me Later merchant network of $727 million, partially offset by proceeds of $1.4 billion for sales of investments.
72
Year Ended December 31,
2013
2012
2011
(In millions)
Net cash provided by (used in):
Operating activities
4,995
3,838
3,274
Investing activities
(6,012
)
(3,763
)
(3,307
)
Financing activities
(1,354
)
1,951
(838
)
Effect of exchange rates on cash and cash equivalents
48
100
(15
)
Net increase/(decrease) in cash and cash equivalents
(2,323
)
2,126
(886
)