eBay 2013 Annual Report Download - page 69
Download and view the complete annual report
Please find page 69 of the 2013 eBay annual report below. You can navigate through the pages in the report by either clicking on the pages listed below, or by using the keyword search tool below to find specific information within the annual report.-
 1
1 -
2
-
3
-
4
-
5
-
6
-
7
-
8
-
9
-
10
-
11
-
12
-
13
-
14
-
15
-
16
-
17
-
18
-
19
-
20
-
21
-
22
-
23
-
24
-
25
-
26
-
27
-
28
-
29
-
30
-
31
-
32
-
33
-
34
-
35
-
36
-
37
-
38
-
39
-
40
-
41
-
42
-
43
-
44
-
45
-
46
-
47
-
48
-
49
-
50
-
51
-
52
-
53
-
54
-
55
-
56
-
57
-
58
-
 59
59 -
 60
60 -
 61
61 -
 62
62 -
 63
63 -
 64
64 -
 65
65 -
 66
66 -
 67
67 -
 68
68 -
 69
69 -
 70
70 -
 71
71 -
 72
72 -
 73
73 -
 74
74 -
 75
75 -
 76
76 -
 77
77 -
 78
78 -
 79
79 -
80
-
81
-
82
-
83
-
84
-
85
-
86
-
87
-
88
-
89
-
90
-
91
-
92
-
93
-
94
-
95
-
96
-
97
-
98
-
99
-
100
-
101
-
102
-
103
-
104
-
105
-
106
-
107
-
108
-
109
-
110
-
111
-
112
-
113
-
114
-
115
-
116
-
117
-
118
-
119
-
120
-
121
-
122
-
123
-
124
-
125
-
126
-
127
-
128
-
129
-
130
-
131
-
132
-
133
-
134
-
135
-
136
-
137
-
138
-
139
-
140
-
141
-
142
-
143
-
144
-
145
-
146
-
147
-
148
-
149
-
150
-
151
-
152
-
153
-
154
-
155
-
156
-
157
-
158
-
159
-
160
-
161
-
162
-
163
-
164
-
165
-
166
-
167
 |
 |
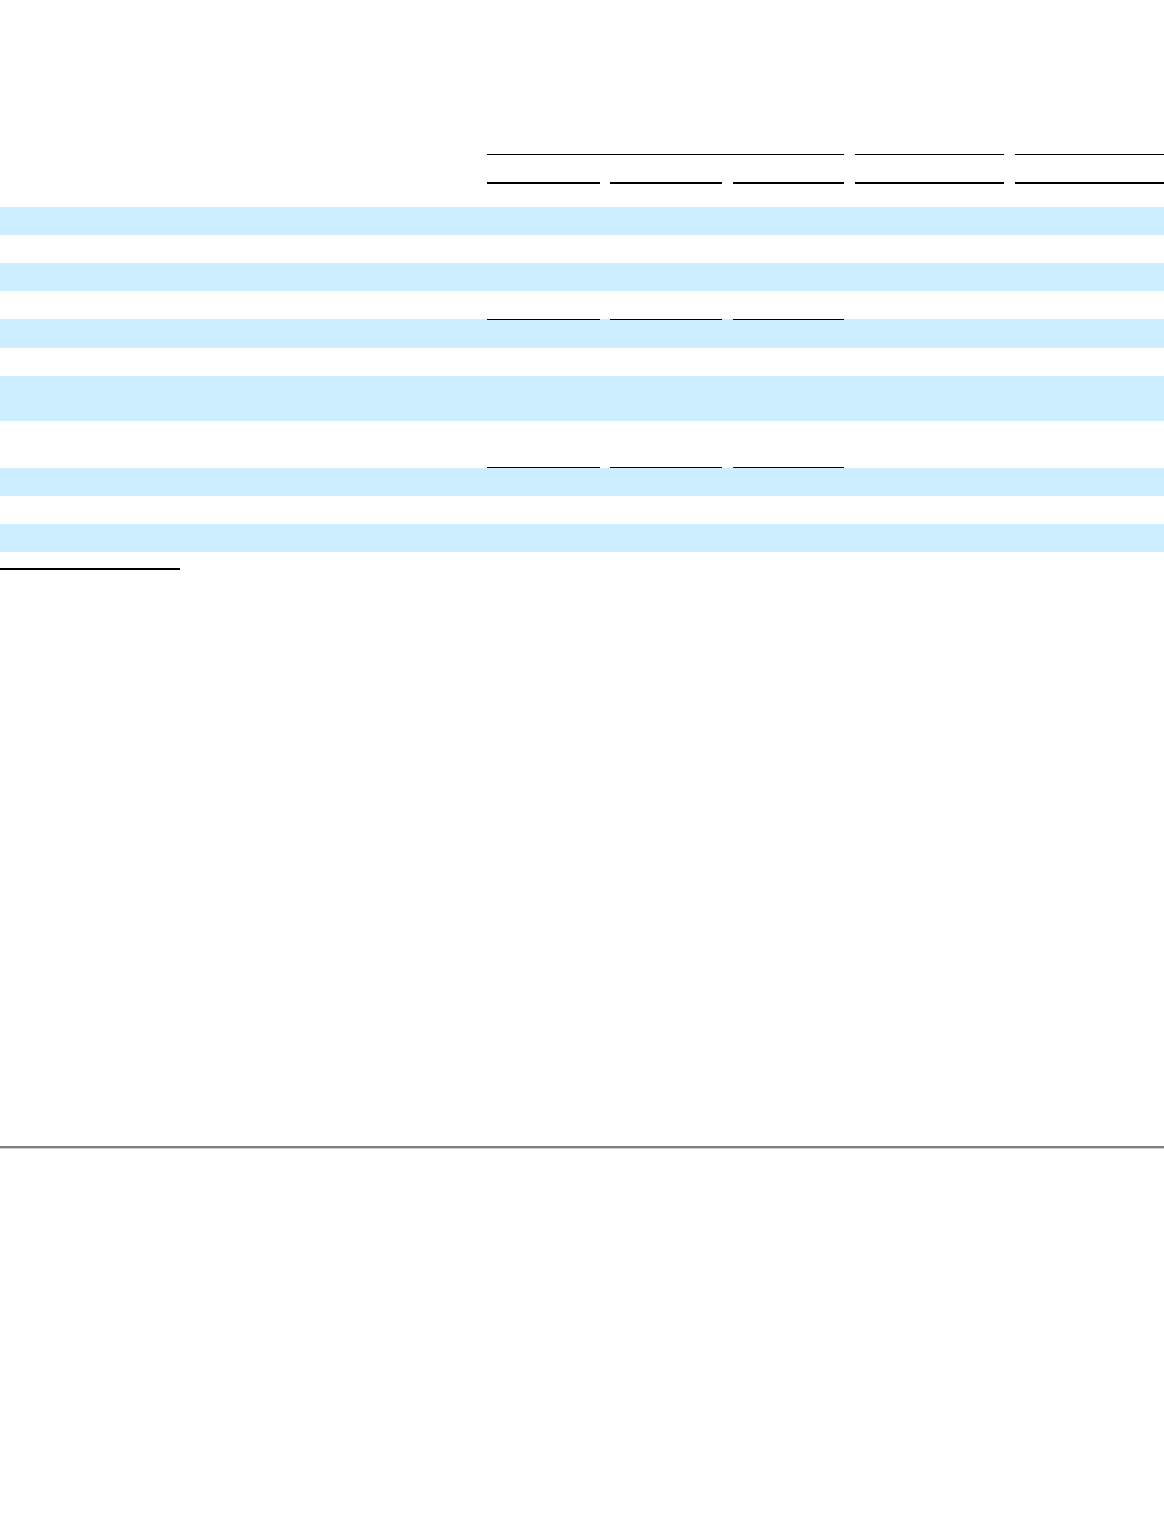
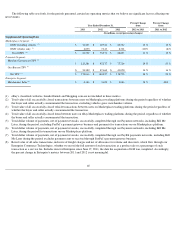
The following table sets forth, for the periods presented, certain key operating metrics that we believe are significant factors affecting our
net revenues.
65
Year Ended December 31,
Percent Change
from
Percent Change
from
2013
2012
2011
2012 to 2013
2011 to 2012
(In millions, except percentage changes)
Supplemental Operating Data:
Marketplaces Segment:
(1)
GMV excluding vehicles
(2)
$
76,495
$
67,763
$
60,332
13
%
12
%
GMV vehicles only
(3)
6,835
7,613
8,301
(10
)%
(8
)%
Total GMV
(4)
$
83,330
$
75,376
$
68,633
11
%
10
%
Payments Segment:
Merchant Services net TPV
(5)
$
125,281
$
97,277
$
77,700
29
%
25
%
On eBay net TPV
(6)
$
54,382
$
47,660
$
41,058
14
%
16
%
Net TPV
(7)
$
179,663
$
144,937
$
118,758
24
%
22
%
Enterprise Segment:
Merchandise Sales
(8)
$
4,180
$
3,682
$
2,046
14
%
N/A
(1)
eBay's classifieds websites, brands4friends and Shopping.com are not included in these metrics.
(2)
Total value of all successfully closed transactions between users on Marketplaces trading platforms during the period regardless of whether
the buyer and seller actually consummated the transaction, excluding vehicles gross merchandise volume.
(3) Total value of all successfully closed vehicle transactions between users on Marketplaces trading platforms during the period regardless of
whether the buyer and seller actually consummated the transaction.
(4)
Total value of all successfully closed items between users on eBay Marketplaces trading platforms during the period, regardless of whether
the buyer and seller actually consummated the transaction.
(5) Total dollar volume of payments, net of payment reversals, successfully completed through our Payments networks, including Bill Me
Later, during the period, excluding PayPal’s payment gateway business and payments for transactions on our Marketplaces platform.
(6) Total dollar volume of payments, net of payment reversals, successfully completed through our Payments networks, including Bill Me
Later, during the period for transactions on our Marketplaces platform.
(7) Total dollar volume of payments, net of payment reversals, successfully completed through our PayPal payments networks, including Bill
Me Later during the period; excludes payments sent or received through PayPal’s payment gateway business.
(8) Retail value of all sales transactions, inclusive of freight charges and net of allowance for returns and discounts, which flow through our
Enterprise Commerce Technologies, whether we record the full amount of such transaction as a product sale or a percentage of such
transaction as a service fee. Includes data for Enterprise since June 17, 2011, the date the acquisition of GSI was completed. Accordingly,
the percent change in Enterprise's metrics between 2011 and 2012 is not meaningful.