eBay 2013 Annual Report Download - page 116
Download and view the complete annual report
Please find page 116 of the 2013 eBay annual report below. You can navigate through the pages in the report by either clicking on the pages listed below, or by using the keyword search tool below to find specific information within the annual report.-
 1
1 -
2
-
3
-
4
-
5
-
6
-
7
-
8
-
9
-
10
-
11
-
12
-
13
-
14
-
15
-
16
-
17
-
18
-
19
-
20
-
21
-
22
-
23
-
24
-
25
-
26
-
27
-
28
-
29
-
30
-
31
-
32
-
33
-
34
-
35
-
36
-
37
-
38
-
39
-
40
-
41
-
42
-
43
-
44
-
45
-
46
-
47
-
48
-
49
-
50
-
51
-
52
-
53
-
54
-
55
-
56
-
57
-
58
-
59
-
60
-
61
-
62
-
63
-
64
-
65
-
66
-
67
-
68
-
69
-
70
-
71
-
72
-
73
-
74
-
75
-
76
-
77
-
78
-
79
-
80
-
81
-
82
-
83
-
84
-
85
-
86
-
87
-
88
-
89
-
90
-
91
-
92
-
93
-
94
-
95
-
96
-
97
-
98
-
99
-
100
-
101
-
102
-
103
-
104
-
105
-
 106
106 -
 107
107 -
 108
108 -
 109
109 -
 110
110 -
 111
111 -
 112
112 -
 113
113 -
 114
114 -
 115
115 -
 116
116 -
 117
117 -
 118
118 -
 119
119 -
 120
120 -
 121
121 -
 122
122 -
 123
123 -
 124
124 -
 125
125 -
 126
126 -
127
-
128
-
129
-
130
-
131
-
132
-
133
-
134
-
135
-
136
-
137
-
138
-
139
-
140
-
141
-
142
-
143
-
144
-
145
-
146
-
147
-
148
-
149
-
150
-
151
-
152
-
153
-
154
-
155
-
156
-
157
-
158
-
159
-
160
-
161
-
162
-
163
-
164
-
165
-
166
-
167
 |
 |
eBay Inc.
NOTES TO CONSOLIDATED FINANCIAL STATEMENTS—(Continued)
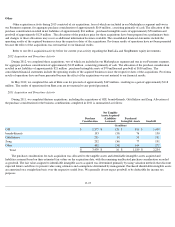
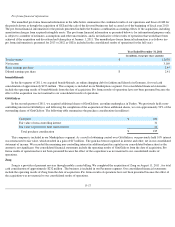
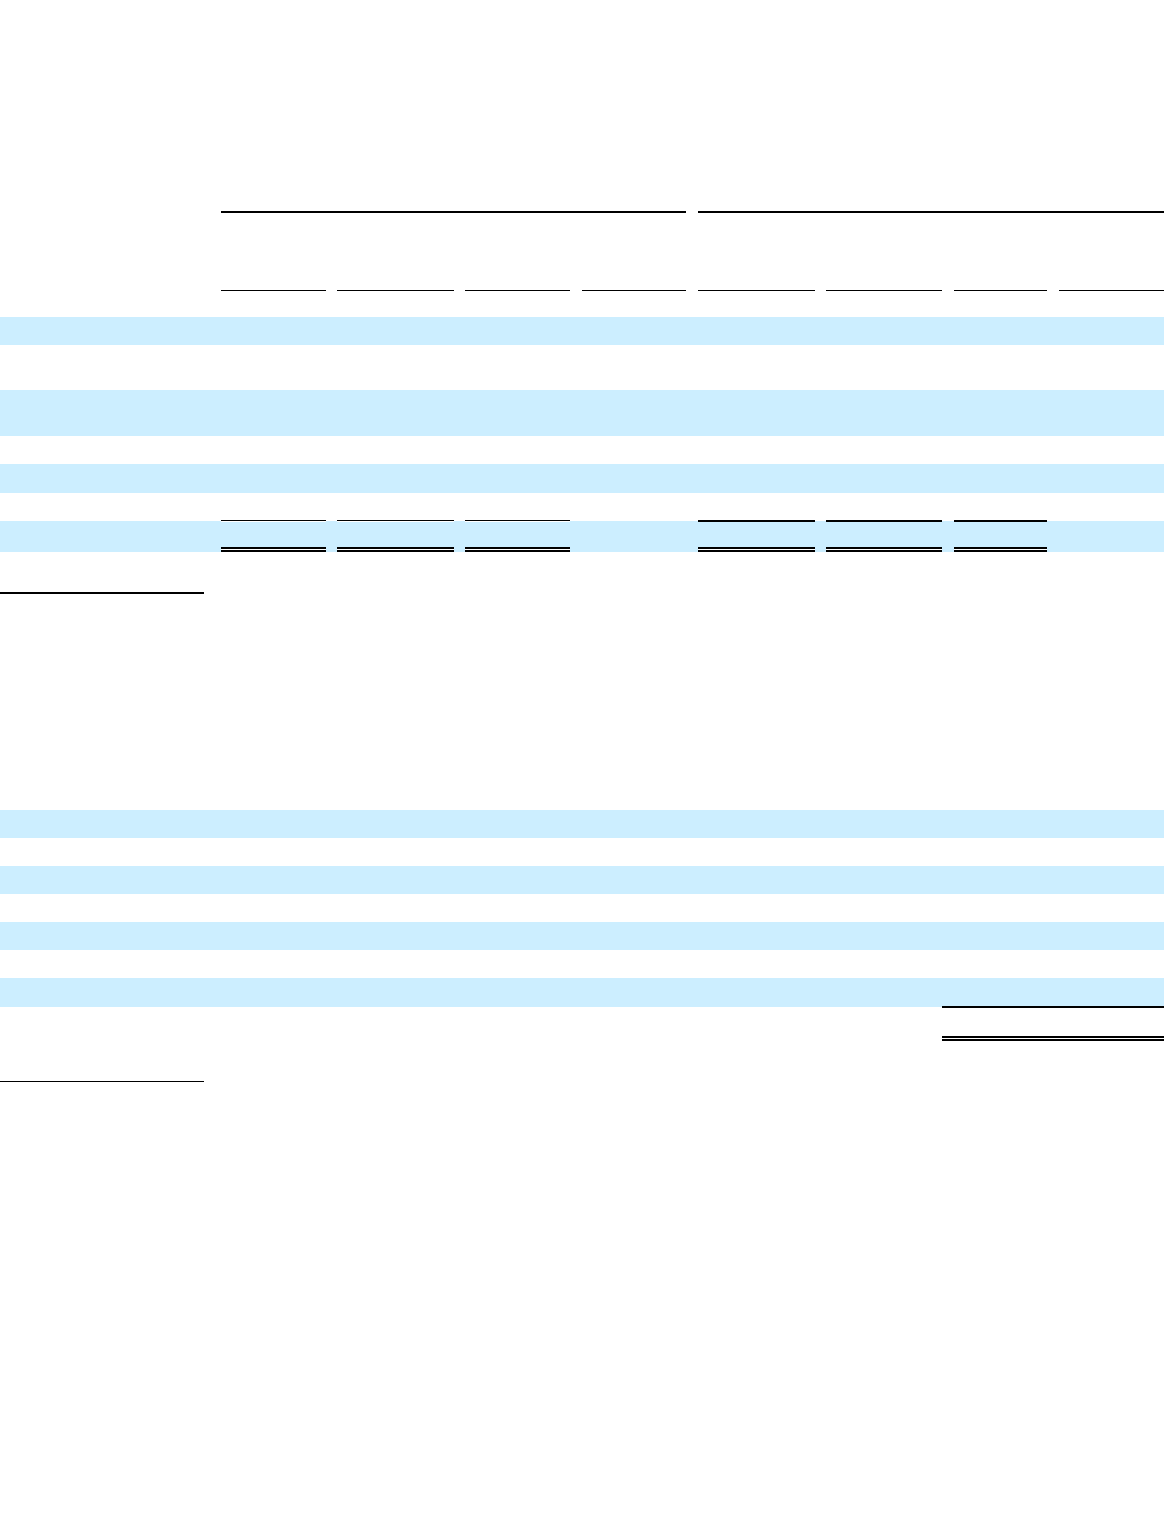
Intangible Assets
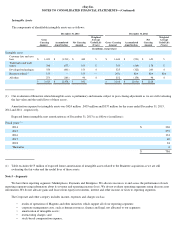
The components of identifiable intangible assets are as follows:
Amortization expense for intangible assets was $424 million , $433 million and $337 million for the years ended December 31, 2013 ,
2012 and 2011 , respectively.
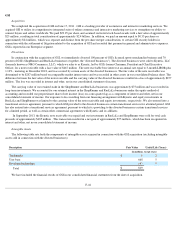
Expected future intangible asset amortization as of December 31, 2013 is as follows (in millions):
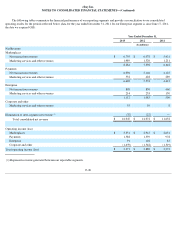
Note 5 – Segments
We have three reporting segments: Marketplaces, Payments and Enterprise. We allocate resources to and assess the performance of each
reporting segment using information about its revenue and operating income (loss). We do not evaluate operating segments using discrete asset
information. We do not allocate gains and losses from equity investments, interest and other income, or taxes to reporting segments.
The Corporate and other category includes income, expenses and charges such as:
December 31, 2013
December 31, 2012
Gross
Carrying
Amount
Accumulated
Amortization
Net Carrying
Amount
Weighted
Average
Useful Life
(Years)
Gross Carrying
Amount
Accumulated
Amortization
Net
Carrying
Amount
Weighted
Average
Useful Life
(Years)
(In millions, except years)
Intangible assets:
Customer lists and user
base
$
1,653
$
(1,213
)
$
440
5
$
1,644
$
(991
)
$
653
5
Trademarks and trade
names
780
(677
)
103
5
743
(569
)
174
5
Developed technologies
554
(401
)
153
4
525
(322
)
203
4
Braintree related
(1)
155
—
155
—
N/A
N/A
N/A
N/A
All other
273
(183
)
90
4
252
(154
)
98
4
$
3,415
$
(2,474
)
$
941
$
3,164
$
(2,036
)
$
1,128
(1) Our evaluation of Braintree related intangible assets is preliminary and remains subject to post-
closing adjustment as we are still evaluating
the fair value and the useful lives of these assets.
Fiscal years
(1)
:
2014
$
326
2015
257
2016
133
2017
40
2018
24
Thereafter
6
$
786
(1) Table excludes $155 million of expected future amortization of intangible assets related to the Braintree acquisition as we are still
evaluating the fair value and the useful lives of these assets.
•
results of operations of Magento and other initiatives which support all of our reporting segments;
•
corporate management costs, such as human resources, finance and legal, not allocated to our segments;
•
amortization of intangible assets;
•
restructuring charges; and
• stock-
based compensation expense.