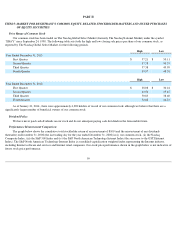
eBay 2013 Annual Report Download - page 72
Download and view the complete annual report
Please find page 72 of the 2013 eBay annual report below. You can navigate through the pages in the report by either clicking on the pages listed below, or by using the keyword search tool below to find specific information within the annual report.-
 1
1 -
2
-
3
-
4
-
5
-
6
-
7
-
8
-
9
-
10
-
11
-
12
-
13
-
14
-
15
-
16
-
17
-
18
-
19
-
20
-
21
-
22
-
23
-
24
-
25
-
26
-
27
-
28
-
29
-
30
-
31
-
32
-
33
-
34
-
35
-
36
-
37
-
38
-
39
-
40
-
41
-
42
-
43
-
44
-
45
-
46
-
47
-
48
-
49
-
50
-
51
-
52
-
53
-
54
-
55
-
56
-
57
-
58
-
59
-
60
-
61
-
 62
62 -
 63
63 -
 64
64 -
 65
65 -
 66
66 -
 67
67 -
 68
68 -
 69
69 -
 70
70 -
 71
71 -
 72
72 -
 73
73 -
 74
74 -
 75
75 -
 76
76 -
 77
77 -
 78
78 -
 79
79 -
 80
80 -
 81
81 -
 82
82 -
83
-
84
-
85
-
86
-
87
-
88
-
89
-
90
-
91
-
92
-
93
-
94
-
95
-
96
-
97
-
98
-
99
-
100
-
101
-
102
-
103
-
104
-
105
-
106
-
107
-
108
-
109
-
110
-
111
-
112
-
113
-
114
-
115
-
116
-
117
-
118
-
119
-
120
-
121
-
122
-
123
-
124
-
125
-
126
-
127
-
128
-
129
-
130
-
131
-
132
-
133
-
134
-
135
-
136
-
137
-
138
-
139
-
140
-
141
-
142
-
143
-
144
-
145
-
146
-
147
-
148
-
149
-
150
-
151
-
152
-
153
-
154
-
155
-
156
-
157
-
158
-
159
-
160
-
161
-
162
-
163
-
164
-
165
-
166
-
167
 |
 |

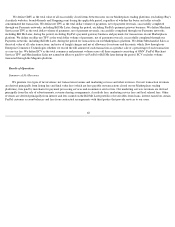
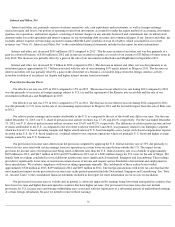
Cost of net revenues consists primarily of costs associated with payment processing, customer support, site operations, fulfillment and
interest expense on borrowings incurred to finance Bill Me Later's portfolio of loan receivables. Significant components of these costs include
bank transaction fees, credit card interchange and assessment fees, interest expense on indebtedness incurred to finance the purchase of
consumer loan receivables related to Bill Me Later accounts, employee compensation, contractor costs, facilities costs, depreciation of
equipment and amortization expense.
Marketplaces
Marketplaces cost of net revenues increased $247 million , or 19% , in 2013 compared to 2012 . The increase was due primarily to the
growth in GMV. Marketplaces cost of net revenues as a percentage of Marketplaces net revenues increased by 1.1 percentage points during 2013
compared to 2012 due primarily to our investment in site operations infrastructure and customer support programs.
Marketplaces cost of net revenues increased $63 million, or 5%, in 2012 compared to 2011. The increase was due primarily to increases in
our customer support costs and site operations associated with our GMV growth. Marketplaces cost of net revenues as a percentage of
Marketplaces net revenues decreased during 2012 compared to the prior year due primarily to improved operating leverage in our site operations
infrastructure, partially offset by investment in customer support programs.
Payments
Payments cost of net revenues increased $466 million , or 21% , in 2013 compared to 2012 due primarily to the impact of growth in net
TPV and growth in our customer support initiatives. Payments cost of net revenues as a percentage of Payments net revenues increased by 0.8
percentage points during 2013 compared to 2012 due primarily to these same factors.
Payments cost of net revenues increased $343 million, or 18%, in 2012 compared to 2011 due primarily to the impact of growth in net
TPV. Payments cost of net revenues as a percentage of Payments net revenues decreased during 2012 compared to 2011 due primarily to a lower
transaction expense rate driven largely by the impact of certain regulatory changes, primarily the Durbin amendment of the Dodd-Frank Wall
Street Reform and Consumer Protection Act.
Enterprise
Enterprise cost of net revenues increased $125 million , or 18% , during 2013 compared to 2012 due primarily to the impact of growth in
Merchandise Sales as well as amortization expense driven by the initial roll out of the new suite of commerce technologies. Enterprise cost of net
revenues as a percentage of Enterprise net revenues increased by 9.6 percentage points during 2013 compared to 2012 due primarily to these
same factors.
Enterprise cost of net revenues were $696 million during 2012 and $374 million in 2011. Cost of net revenues attributable to the
Enterprise segment for 2011 are reflected from June 17, 2011 (the date the acquisition of GSI was completed). Accordingly, comparisons with
Enterprise's cost of revenues for 2012 to 2011 are not meaningful.
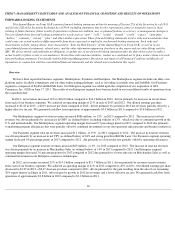
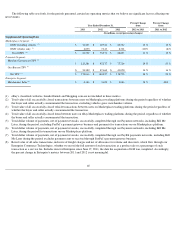
Summary of Operating Expenses, Non-Operating Items and Provision for Income Taxes
The following table summarizes changes in operating expenses, non-operating items and provision for income taxes for the periods
presented:
68
Year Ended December 31,
Change from
2012 to 2013
Change from
2011 to 2012
2013
2012
2011
in Dollars
in %
in Dollars
in %
(In millions, except percentage changes)
Sales and marketing
$
3,060
$
2,913
$
2,435
$
147
5
%
$
478
20
%
Product development
1,768
1,573
1,235
195
12
%
338
27
%
General and administrative
1,703
1,567
1,364
136
9
%
203
15
%
Provision for transaction and loan losses
791
580
517
211
36
%
63
12
%
Amortization of acquired intangible assets
318
335
267
(17
)
(5
)%
68
25
%
Interest and other, net
95
196
1,537
(101
)
(52
)%
(1,341
)
(87
)%
Provision for income taxes
(610
)
(475
)
(681
)
(135
)
28
%
206
(30
)%