eBay 2013 Annual Report Download - page 118
Download and view the complete annual report
Please find page 118 of the 2013 eBay annual report below. You can navigate through the pages in the report by either clicking on the pages listed below, or by using the keyword search tool below to find specific information within the annual report.-
 1
1 -
2
-
3
-
4
-
5
-
6
-
7
-
8
-
9
-
10
-
11
-
12
-
13
-
14
-
15
-
16
-
17
-
18
-
19
-
20
-
21
-
22
-
23
-
24
-
25
-
26
-
27
-
28
-
29
-
30
-
31
-
32
-
33
-
34
-
35
-
36
-
37
-
38
-
39
-
40
-
41
-
42
-
43
-
44
-
45
-
46
-
47
-
48
-
49
-
50
-
51
-
52
-
53
-
54
-
55
-
56
-
57
-
58
-
59
-
60
-
61
-
62
-
63
-
64
-
65
-
66
-
67
-
68
-
69
-
70
-
71
-
72
-
73
-
74
-
75
-
76
-
77
-
78
-
79
-
80
-
81
-
82
-
83
-
84
-
85
-
86
-
87
-
88
-
89
-
90
-
91
-
92
-
93
-
94
-
95
-
96
-
97
-
98
-
99
-
100
-
101
-
102
-
103
-
104
-
105
-
106
-
107
-
 108
108 -
 109
109 -
 110
110 -
 111
111 -
 112
112 -
 113
113 -
 114
114 -
 115
115 -
 116
116 -
 117
117 -
 118
118 -
 119
119 -
 120
120 -
 121
121 -
 122
122 -
 123
123 -
 124
124 -
 125
125 -
 126
126 -
 127
127 -
 128
128 -
129
-
130
-
131
-
132
-
133
-
134
-
135
-
136
-
137
-
138
-
139
-
140
-
141
-
142
-
143
-
144
-
145
-
146
-
147
-
148
-
149
-
150
-
151
-
152
-
153
-
154
-
155
-
156
-
157
-
158
-
159
-
160
-
161
-
162
-
163
-
164
-
165
-
166
-
167
 |
 |

eBay Inc.
NOTES TO CONSOLIDATED FINANCIAL STATEMENTS—(Continued)
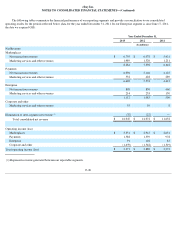
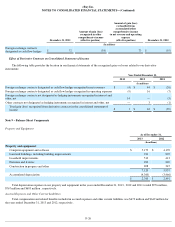
The following tables summarize the financial performance of our reporting segments and provide a reconciliation to our consolidated
operating results for the periods reflected below (data for the year ended December 31, 2011 for our Enterprise segment is since June 17, 2011,
the date we acquired GSI):
(1) Represents revenue generated between our reportable segments.
F-20
Year Ended December 31,
2013
2012
2011
(In millions)
Net Revenue
Marketplaces
Net transaction revenues
$
6,795
$
6,078
$
5,431
Marketing services and other revenues
1,489
1,320
1,211
8,284
7,398
6,642
Payments
Net transaction revenues
6,096
5,146
4,123
Marketing services and other revenues
532
428
289
6,628
5,574
4,412
Enterprise
Net transaction revenues
898
850
460
Marketing services and other revenues
214
233
130
1,112
1,083
590
Corporate and other
Marketing services and other revenues
55
39
8
Elimination of inter-segment net revenue
(1)
(32
)
(22
)
—
Total consolidated net revenue
$
16,047
$
14,072
$
11,652
Operating income (loss)
Marketplaces
$
3,351
$
2,943
$
2,631
Payments
1,588
1,359
978
Enterprise
91
128
83
Corporate and other
(1,659
)
(1,542
)
(1,319
)
Total operating income (loss)
$
3,371
$
2,888
$
2,373