eBay 1998 Annual Report Download - page 26
Download and view the complete annual report
Please find page 26 of the 1998 eBay annual report below. You can navigate through the pages in the report by either clicking on the pages listed below, or by using the keyword search tool below to find specific information within the annual report.-
 1
1 -
2
-
3
-
4
-
5
-
6
-
7
-
8
-
9
-
10
-
11
-
12
-
13
-
14
-
15
-
 16
16 -
 17
17 -
 18
18 -
 19
19 -
 20
20 -
 21
21 -
 22
22 -
 23
23 -
 24
24 -
 25
25 -
 26
26 -
 27
27 -
 28
28 -
 29
29 -
 30
30 -
 31
31 -
 32
32 -
 33
33 -
 34
34 -
 35
35 -
 36
36 -
37
-
38
-
39
-
40
-
41
-
42
-
43
-
44
-
45
-
46
-
47
-
48
-
49
-
50
-
51
-
52
-
53
-
54
-
55
-
56
-
57
-
58
-
59
-
60
-
61
-
62
-
63
-
64
-
65
-
66
-
67
-
68
-
69
-
70
-
71
-
72
-
73
-
74
-
75
-
76
-
77
-
78
-
79
 |
 |

26
Years Ended December 31, 1996, 1997 and 1998
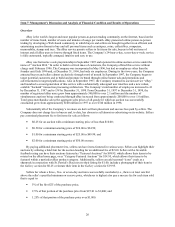
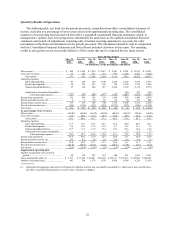
The following table sets forth, for the periods presented, certain data from eBay’ s consolidated statement of
income as a percentage of net revenues. This information should be read in conjunction with the Consolidated
Financial Statements and Notes thereto included elsewhere in this report.
Year Ended December 31,
1996 1997 1998
Net revenues .............................................................................................................. 100.0% 100.0% 100.0%
Cost of net revenues.................................................................................................... 3.8 13.0 14.5
Gross profit ............................................................................................................. 96.2 87.0 85.5
Operating expenses:
Sales and marketing ................................................................................................ 8.6 30.1 41.9
Product development .............................................................................................. 7.5 14.5 9.7
General and administrative ..................................................................................... 12.1 16.5 19.2
Amortization of acquired intangibles...................................................................... — — 1.7
Total operating expenses.................................................................................... 28.2 61.1 72.5
Income from operations .............................................................................................. 68.0 25.9 13.0
Interest and other income, net..................................................................................... 0.3 1.0 1.9
Income before income taxes ....................................................................................... 68.3 26.9 14.9
Provision for income taxes.......................................................................................... (28.5) (11.7) (9.8)
Net income.................................................................................................................. 39.8% 15.2% 5.1%
Net Revenues
eBay’ s net revenues increased from $372,000 in 1996 to $5.7 million in 1997 and to $47.4 million in 1998,
primarily as a result of growth in the number of items of merchandise listed by sellers for auction on the eBay
website and growth in the number of auction transactions successfully completed. The increase from 1996 to 1997
was, to a lesser extent, the result of small increases in average transaction size and certain increases in the placement
fees for various forms of featured placements for listed items.
Cost of Net Revenues
Cost of net revenues increased from $14,000, or 3.8% of net revenues, in 1996 to $746,000, or 13.0% of net
revenues, in 1997, and to $6.9 million, or 14.5% of net revenues, in 1998. The increases primarily resulted from the
Company’ s expansion of its customer support organization, increases in bank processing charges for customer fees
paid by credit cards, depreciation of the equipment required for the eBay website operations and ISP connectivity
charges.
Sales and Marketing
eBay’ s sales and marketing expenses increased from $32,000, or 8.6% of net revenues, in 1996 to $1.7 million,
or 30.1% of net revenues, in 1997, and to $19.8 million, or 41.9% of net revenues, in 1998. The increases from 1996
to 1997 primarily resulted from the building of a sales and marketing organization, which began late in the fourth
quarter of 1996, and the commencement of significant advertising and promotional activities, which began in the
third quarter of 1997. The increases from 1997 to 1998 primarily resulted from substantial increases in advertising
and promotional expenses, including costs associated with a national print, broadcast and online advertising
campaign and expenses associated with a marketing agreement with AOL, both of which commenced in the second
half of 1998, as well as from continued growth in the number of sales and marketing personnel.