eBay 1998 Annual Report Download - page 19
Download and view the complete annual report
Please find page 19 of the 1998 eBay annual report below. You can navigate through the pages in the report by either clicking on the pages listed below, or by using the keyword search tool below to find specific information within the annual report.-
 1
1 -
2
-
3
-
4
-
5
-
6
-
7
-
8
-
 9
9 -
 10
10 -
 11
11 -
 12
12 -
 13
13 -
 14
14 -
 15
15 -
 16
16 -
 17
17 -
 18
18 -
 19
19 -
 20
20 -
 21
21 -
 22
22 -
 23
23 -
 24
24 -
 25
25 -
 26
26 -
 27
27 -
 28
28 -
 29
29 -
30
-
31
-
32
-
33
-
34
-
35
-
36
-
37
-
38
-
39
-
40
-
41
-
42
-
43
-
44
-
45
-
46
-
47
-
48
-
49
-
50
-
51
-
52
-
53
-
54
-
55
-
56
-
57
-
58
-
59
-
60
-
61
-
62
-
63
-
64
-
65
-
66
-
67
-
68
-
69
-
70
-
71
-
72
-
73
-
74
-
75
-
76
-
77
-
78
-
79
 |
 |

19
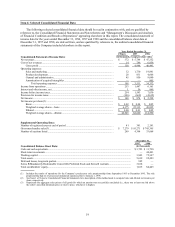
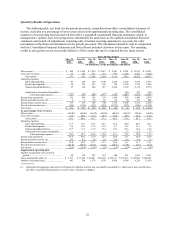
Item 6: Selected Consolidated Financial Data
The following selected consolidated financial data should be read in conjunction with, and are qualified by
reference to, the Consolidated Financial Statements and Notes thereto and “Management’ s Discussion and Analysis
of Financial Condition and Results of Operations” appearing elsewhere in this report. The consolidated statement of
income data for the years ended December 31, 1996, 1997 and 1998 and the consolidated balance sheet data at
December 31, 1997 and 1998, are derived from, and are qualified by reference to, the audited consolidated financial
statements of the Company included elsewhere in this report.
Year Ended December 31,
1996(1) 1997 1998
Consolidated Statement of Income Data: (in thousands, except per share data)
Net revenues......................................................................................................................... $ 372 $ 5,744 $ 47,352
Cost of net revenues............................................................................................................ . 14 746 6,859
Gross profit ................................................................................................................. . 358 4,998 40,493
Operating expenses:
Sales and marketing .................................................................................................... . 32 1,730 19,841
Product development................................................................................................... . 28 831 4,606
General and administrative.......................................................................................... . 45 950 9,080
Amortization of acquired intangibles.......................................................................... . — — 805
Total operating expenses..................................................................................... . 105 3,511 34,332
Income from operations ...................................................................................................... . 253 1,487 6,161
Interest and other income, net ............................................................................................. . 1 56 869
Income before income taxes................................................................................................ . 254 1,543 7,030
Provision for income taxes.................................................................................................. . (106) (669) (4,632)
Net income........................................................................................................................... $ 148 $ 874 $ 2,398
Net income per share(2): .....................................................................................................
Basic............................................................................................................................. $ 0.02 $ 0.04 $ 0.05
Weighted average shares—basic................................................................................. . 6,375 22,313 49,895
Diluted ......................................................................................................................... $ 0.00 $ 0.01 $ 0.02
Weighted average shares—diluted.............................................................................. . 42,945 82,660 114,590
Supplemental Operating Data:
Number of registered users at end of period ....................................................................... . 41 341 2,181
Gross merchandise sales(3)................................................................................................. . $ 7,279 $ 95,271 $ 745,395
Number of auctions listed ................................................................................................... . 289 4,394 33,668
December 31,
1997 1998
Consolidated Balance Sheet Data: (in thousands)
Cash and cash equivalents............................................................................................................................... $ 3,723 $ 31,790
Short-term investments ................................................................................................................................... — 40,401
Working capital............................................................................................................................................... 3,843 75,347
Total assets...................................................................................................................................................... 5,619 92,483
Debt and leases, long-term portion ................................................................................................................. 305 —
Series B Mandatorily Redeemable Convertible Preferred Stock and Series B warrants ................................. 3,018 —
Total stockholders’ equity............................................................................................................................... 1,015 84,445
(1) Includes the results of operations for the Company’ s predecessor sole proprietorship from September 1995 to December 1995. The sole
proprietorship had no revenues and immaterial expenses prior to January 1, 1996.
(2) See Note 1 of Notes to Consolidated Financial Statements for a description of the method used to compute basic and diluted net income per
share, respectively.
(3) Represents the aggregate sales prices of all goods for which an auction was successfully concluded (i.e., there was at least one bid above
the seller’s specified minimum price or reserve price, whichever is higher).