eBay 1998 Annual Report Download - page 22
Download and view the complete annual report
Please find page 22 of the 1998 eBay annual report below. You can navigate through the pages in the report by either clicking on the pages listed below, or by using the keyword search tool below to find specific information within the annual report.-
 1
1 -
2
-
3
-
4
-
5
-
6
-
7
-
8
-
9
-
10
-
11
-
 12
12 -
 13
13 -
 14
14 -
 15
15 -
 16
16 -
 17
17 -
 18
18 -
 19
19 -
 20
20 -
 21
21 -
 22
22 -
 23
23 -
 24
24 -
 25
25 -
 26
26 -
 27
27 -
 28
28 -
 29
29 -
 30
30 -
 31
31 -
 32
32 -
33
-
34
-
35
-
36
-
37
-
38
-
39
-
40
-
41
-
42
-
43
-
44
-
45
-
46
-
47
-
48
-
49
-
50
-
51
-
52
-
53
-
54
-
55
-
56
-
57
-
58
-
59
-
60
-
61
-
62
-
63
-
64
-
65
-
66
-
67
-
68
-
69
-
70
-
71
-
72
-
73
-
74
-
75
-
76
-
77
-
78
-
79
 |
 |

22
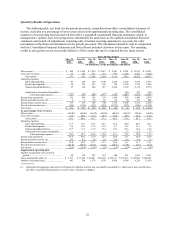
Quarterly Results of Operations
The following table sets forth, for the periods presented, certain data from eBay’ s consolidated statement of
income, such data as a percentage of net revenues and certain supplemental operating data. The consolidated
statement of income data has been derived from eBay’ s unaudited consolidated financial statements, which, in
management’ s opinion, have been prepared on substantially the same basis as the audited consolidated financial
statements and include all adjustments, consisting only of normal recurring adjustments, necessary for a fair
presentation of the financial information for the periods presented. This information should be read in conjunction
with the Consolidated Financial Statements and Notes thereto included elsewhere in this report. The operating
results in any quarter are not necessarily indicative of the results that may be expected for any future period.
Three Months Ended
Mar. 31,
1997
June 30,
1997
Sep. 30,
1997
Dec. 31,
1997
Mar. 31,
1998
June 30,
1998
Sep. 30,
1998
Dec. 31,
1998
(in thousands, except percentages; unaudited)
Net revenues................................................... $ 604 $ 1,054 $ 1,459 $ 2,627 $ 5,981 $ 8,941 $ 12,935 $ 19,495
Cost of net revenues ....................................... 33 127 253 333 630 1,106 2,103 3,020
Gross profit............................................. 571 927 1,206 2,294 5,351 7,835 10,832 16,475
Operating expenses:
Sales and marketing................................ 83 129 369 1,149 2,106 2,504 5,476 9,755
Product development .............................. 58 151 257 365 518 1,030 1,514 1,544
General and administrative ..................... 95 138 260 457 1,028 3,159 2,115 2,778
Amortization of acquired intangibles...... — — — — — 150 327 328
Total operating expenses................. 236 418 886 1,971 3,652 6,843 9,432 14,405
Income from operations.................................. 335 509 320 323 1,699 992 1,400 2,070
Interest and other income, net......................... 2 2 26 26 22 54 111 682
Income before income taxes ........................... 337 511 346 349 1,721 1,046 1,511 2,752
Provision for income taxes ............................. (144) (218) (147) (160) (1,573) (979) (848) (1,232)
Net income ..................................................... $ 193 $ 293 $ 199 $ 189 $ 148 $ 67 $ 663 $ 1,520
As a percentage of net revenues:
Net revenues................................................... 100.0% 100.0% 100.0% 100.0% 100.0% 100.0% 100.0% 100.0%
Cost of net revenues ....................................... 5.5 12.0 17.3 12.7 10.5 12.4 16.3 15.5
Gross profit............................................. 94.5 88.0 82.7 87.3 89.5 87.6 83.7 84.5
Operating expenses:
Sales and marketing................................ 13.7 12.3 25.3 43.7 35.2 28.0 42.3 50.1
Product development .............................. 9.6 14.3 17.6 13.9 8.7 11.5 11.7 7.9
General and administrative ..................... 15.7 13.1 17.9 17.4 17.2 35.3 16.4 14.2
Amortization of acquired intangibles...... — — — — — 1.7 2.5 1.7
Total operating expenses................. 39.0 39.7 60.8 75.0 61.1 76.5 72.9 73.9
Income from operations.................................. 55.5 48.3 21.9 12.3 28.4 11.1 10.8 10.6
Interest and other income, net......................... 0.3 0.2 1.8 1.0 0.4 0.6 0.9 3.5
Income before income taxes ........................... 55.8 48.5 23.7 13.3 28.8 11.7 11.7 14.1
Provision for income taxes ............................. (23.8) (20.7) (10.1) (6.1) (26.3) (11.0) (6.6) (6.3)
Net income ..................................................... 32.0% 27.8% 13.6% 7.2% 2.5% 0.7% 5.1% 7.8%
Supplemental operating data:
Number of registered users at end of
period........................................................ . 88 150 223 341 580 851 1,265 2,181
Gross merchandise sales (1). .......................... $ 9,337 $ 17,630 $ 24,281 $ 44,023 $ 104,113 $ 139,633 $ 195,046 $ 306,603
Number of auctions listed............................... 443 794 1,178 1,979 4,209 6,584 9,236 13,639
(1) Represents the aggregate sales prices of all goods for which an auction was successfully concluded (i.e., there was at least one bid above
the seller’ s specified minimum price or reserve price, whichever is higher).