Toyota 2010 Annual Report Download - page 98
Download and view the complete annual report
Please find page 98 of the 2010 Toyota annual report below. You can navigate through the pages in the report by either clicking on the pages listed below, or by using the keyword search tool below to find specific information within the annual report.-
 1
1 -
2
-
3
-
4
-
5
-
6
-
7
-
8
-
9
-
10
-
11
-
12
-
13
-
14
-
15
-
16
-
17
-
18
-
19
-
20
-
21
-
22
-
23
-
24
-
25
-
26
-
27
-
28
-
29
-
30
-
31
-
32
-
33
-
34
-
35
-
36
-
37
-
38
-
39
-
40
-
41
-
42
-
43
-
44
-
45
-
46
-
47
-
48
-
49
-
50
-
51
-
52
-
53
-
54
-
55
-
56
-
57
-
58
-
59
-
60
-
61
-
62
-
63
-
64
-
65
-
66
-
67
-
68
-
69
-
70
-
71
-
72
-
73
-
74
-
75
-
76
-
77
-
78
-
79
-
80
-
81
-
82
-
83
-
84
-
85
-
86
-
87
-
 88
88 -
 89
89 -
 90
90 -
 91
91 -
 92
92 -
 93
93 -
 94
94 -
 95
95 -
 96
96 -
 97
97 -
 98
98 -
 99
99 -
 100
100 -
 101
101 -
 102
102 -
 103
103 -
 104
104 -
 105
105
 |
 |

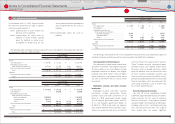
TOYOTA ANNUAL REPORT 2010 96
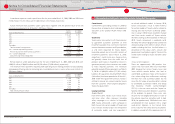
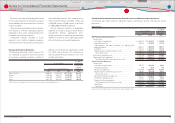
Statement of cash fl ows
Yen in millions U.S. dollars in millions
For the year ended March 31, 2010 For the year ended March 31, 2010
Non-Financial
Services
Businesses
Financial
Services
Businesses Consolidated
Non-Financial
Services
Businesses
Financial
Services
Businesses Consolidated
Cash fl ows from operating activities
Net income ···················································································································· ¥ 116,218 ¥ 128,106 ¥ 244,212 $ 1,249 $ 1,377 $ 2,625
Adjustments to reconcile net income to net cash provided by
operating activities
Depreciation ········································································································· 1,065,749 348,820 1,414,569 11,455 3,749 15,204
Provision for doubtful accounts and credit losses ··························· 1,905 98,870 100,775 20 1,063 1,083
Pension and severance costs, less payments ······································ 55 1,199 1,254 0 13 13
Losses on disposal of fi xed assets······························································ 46,661 276 46,937 502 3 505
Unrealized losses on available-for-sale securities, net ···················· 2,486 ̶ 2,486 27 ̶ 27
Deferred income taxes ···················································································· (14,183) 39,759 25,537 (152) 427 274
Equity in (earnings) losses of affi liated companies ·························· (109,944) 64,536 (45,408) (1,182) 694 (488)
Changes in operating assets and liabilities, and other ··················· 733,338 133,275 768,168 7,882 1,432 8,256
Net cash provided by operating activities ········································ 1,842,285 814,841 2,558,530 19,801 8,758 27,499
Cash fl ows from investing activities
Additions to fi nance receivables ······································································· ̶ (13,492,119) (7,806,201) ̶ (145,014) (83,902)
Collection of and proceeds from sales of fi nance receivables··········· ̶ 13,107,531 7,517,968 ̶ 140,880 80,804
Additions to fi xed assets excluding equipment leased to others ···· (599,154) (5,382) (604,536) (6,440) (58) (6,498)
Additions to equipment leased to others ····················································· (64,345) (768,720) (833,065) (692) (8,262) (8,954)
Proceeds from sales of fi xed assets excluding equipment leased to
others ···························································································································· 46,070 6,403 52,473 495 69 564
Proceeds from sales of equipment leased to others ······························ 36,668 428,424 465,092 394 4,605 4,999
Purchases of marketable securities and security investments ·········· (2,310,912) (101,270) (2,412,182) (24,838) (1,088) (25,926)
Proceeds from sales of and maturity of marketable securities and
security investments ···························································································· 1,012,781 95,960 1,108,741 10,886 1,031 11,917
Payment for additional investments in affi liated companies, net of
cash acquired ··········································································································· (1,020) ̶(1,020) (11) ̶(11)
Changes in investments and other assets, and other ···························· (259,089) 102,497 (337,454) (2,784) 1,101 (3,627)
Net cash used in investing activities ························································ (2,139,001) (626,676) (2,850,184) (22,990) (6,736) (30,634)
Cash fl ows from fi nancing activities
Proceeds from issuance of long-term debt ················································· 492,300 2,733,465 3,178,310 5,292 29,379 34,161
Payments of long-term debt ··············································································· (77,033) (2,926,308) (2,938,202) (828) (31,452) (31,580)
Decrease in short-term borrowings ································································· (249,238) (251,544) (335,363) (2,679) (2,704) (3,605)
Dividends paid ············································································································· (172,476) ̶ (172,476) (1,854) ̶ (1,854)
Purchase of common stock, and other ·························································· (10,251) ̶ (10,251) (110) ̶ (110)
Net cash used in fi nancing activities ······················································· (16,698) (444,387) (277,982) (179) (4,777) (2,988)
Eff ect of exchange rate changes on cash and cash equivalents ·········· 4,092 (12,990) (8,898) 44 (139) (95)
Net decrease in cash and cash equivalents ····················································· (309,322) (269,212) (578,534) (3,324) (2,894) (6,218)
Cash and cash equivalents at beginning of year ·········································· 1,648,143 796,137 2,444,280 17,714 8,557 26,271
Cash and cash equivalents at end of year ························································ ¥ 1,338,821 ¥ 526,925 ¥ 1,865,746 $ 14,390 $ 5,663 $ 20,053
Financial Section
Financial Section
Investor Information
Corporate Information
Special Feature
Consolidated
Performance Highlights
Business Overview
Top Messages
Notes to Consolidated Financial Statements