Toyota 2010 Annual Report Download - page 49
Download and view the complete annual report
Please find page 49 of the 2010 Toyota annual report below. You can navigate through the pages in the report by either clicking on the pages listed below, or by using the keyword search tool below to find specific information within the annual report.-
 1
1 -
2
-
3
-
4
-
5
-
6
-
7
-
8
-
9
-
10
-
11
-
12
-
13
-
14
-
15
-
16
-
17
-
18
-
19
-
20
-
21
-
22
-
23
-
24
-
25
-
26
-
27
-
28
-
29
-
30
-
31
-
32
-
33
-
34
-
35
-
36
-
37
-
38
-
 39
39 -
 40
40 -
 41
41 -
 42
42 -
 43
43 -
 44
44 -
 45
45 -
 46
46 -
 47
47 -
 48
48 -
 49
49 -
 50
50 -
 51
51 -
 52
52 -
 53
53 -
 54
54 -
 55
55 -
 56
56 -
 57
57 -
 58
58 -
 59
59 -
60
-
61
-
62
-
63
-
64
-
65
-
66
-
67
-
68
-
69
-
70
-
71
-
72
-
73
-
74
-
75
-
76
-
77
-
78
-
79
-
80
-
81
-
82
-
83
-
84
-
85
-
86
-
87
-
88
-
89
-
90
-
91
-
92
-
93
-
94
-
95
-
96
-
97
-
98
-
99
-
100
-
101
-
102
-
103
-
104
-
105
 |
 |

47
TOYOTA ANNUAL REPORT 2010
prior calendar year, respectively. Aff ected by this
downturn, Toyotas vehicle unit sales decreased
to 7,567 thousand vehicles, or by 15.1%,
compared to the prior fi scal year. The decrease in
net revenues was also due to the eff ect of foreign
currency exchange rate fl uctuations and changes
in the market demand resulting from a shift in
consumer preference towards small vehicles and
low-price vehicles.
Toyotas net revenues include net revenues from
sales of products, consisting of net revenues
from automotive operations and all other
operations, which decreased by 22.8% during
fi scal 2009 compared with the prior fi scal year
to ¥19,173.7 billion, and net revenues from
fi nancial services operations, which decreased
by 7.7% during fi scal 2009 compared with the
prior fi scal year to ¥1,355.8 billion. Eliminating
the diff erence in the Japanese yen value used
for translation purposes, net revenues from sales
of products would have been approximately
¥21,011.3 billion, a 15.3% decrease during fi scal
2009 compared with the prior fi scal year. The
decrease in net revenues from sales of products is
primarily attributable to a substantial contraction
of the automotive market caused by a rapid
deterioration of the world economy following
the fi nancial crisis since the fall of 2008, as well as
changes in market demand resulting from a shift
in consumer preference towards small vehicles
and low-price vehicles. Eliminating the diff erence
in the Japanese yen value used for translation
purposes, net revenues from fi nancial services
operations would have been approximately
¥1,549.4 billion, a 5.5% increase during fi scal 2009
compared with the prior year. The increase in net
revenues from fi nancial services operations is
primarily attributable to the increase in volume
of fi nancings as a result of an increase in market
share primarily of the fi nance subsidiary in North
America.
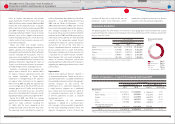
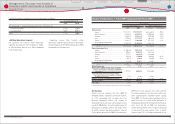
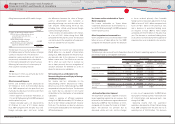
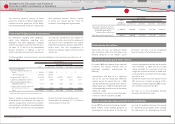
Toyotas net revenues by product category in each business to external customer is as follows:
Yen in millions
Year ended March 31, 2009 vs. 2008 change
2008 2009 Amount Percentage
Vehicles ······································································· ¥20,723,588 ¥15,635,490 ¥(5,088,098) ‒24.6%
Parts and components for
overseas production ······································· 342,244 298,176 (44,068) ‒12.9%
Parts and components for after service ···· 1,785,684 1,575,316 (210,368) ‒11.8%
Other ············································································ 1,308,738 1,041,519 (267,219) ‒20.4%
Total Automotive ·········································· 24,160,254 18,550,501 (5,609,753) ‒23.2%
All Other ····································································· 660,256 623,219 (37,037) ‒5.6%
Total sales of products ········································ 24,820,510 19,173,720 (5,646,790) ‒22.8%
Financial services ··················································· 1,468,730 1,355,850 (112,880) ‒7.7%
Total ····································································· ¥26,289,240 ¥20,529,570 ¥(5,759,670) ‒21.9%
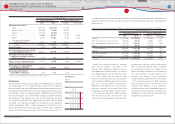
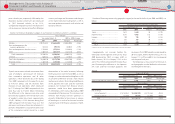
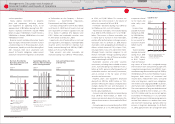
Number of fi nancing contracts in thousands
Year ended March 31, 2009 vs. 2008 change
2008 2009 Amount Percentage
Japan ······································································· 1,614 1,660 46 +2.9%
North America ··················································· 4,241 4,403 162 +3.8%
Europe ···································································· 709 748 39 +5.5%
Asia ··········································································· 357 387 30 +8.4%
Other* ····································································· 413 440 27 +6.5%
Total ·································································· 7,334 7,638 304 +4.1%
* Other consists of Central and South America, Oceania and Africa.
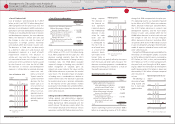
Geographically, net revenues (before the
elimination of intersegment revenues) for fi scal
2009 decreased by 20.4% in Japan, 34.0% in
North America, 24.5% in Europe, 12.9% in Asia
and 17.9% in Other compared with the prior fi scal
year. Eliminating the diff erence in the Japanese
yen value used for translation purposes, net
revenues in fi scal 2009 would have decreased by
20.4% in Japan, 25.0% in North America, 14.1% in
Europe, 1.1% in Other and 0.5% in Asia compared
with the prior fi scal year.
The following is a discussion of net revenues in
each geographic market (before the elimination
of intersegment revenues).
Number of fi nancing contracts by geographic region (at the end of the fi scal year 2008 and 2009) is as
follows:
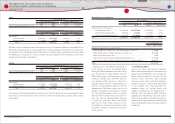
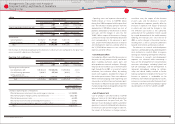
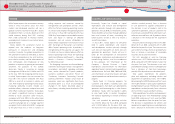
Japan
Thousands of units
Year ended March 31, 2009 vs. 2008 change
2008 2009 Amount Percentage
Toyotas consolidated vehicle unit sales ·
2,188 1,945 (243) ‒11.1%
Yen in millions
Year ended March 31, 2009 vs. 2008 change
2008 2009 Amount Percentage
Net revenues:
Sales of products ······································ ¥15,183,262 ¥12,067,494 ¥(3,115,768) ‒20.5%
Financial services ····································· 132,550 119,243 (13,307) ‒10.0%
Total ························································· ¥15,315,812 ¥12,186,737 ¥(3,129,075) ‒20.4%
Financial Section
Financial Section
Investor Information
Corporate Information
Special Feature
Consolidated
Performance Highlights
Business Overview
Top Messages
Management's Discussion and Analysis of
Financial Condition and Results of Operations