Toyota 2010 Annual Report Download - page 41
Download and view the complete annual report
Please find page 41 of the 2010 Toyota annual report below. You can navigate through the pages in the report by either clicking on the pages listed below, or by using the keyword search tool below to find specific information within the annual report.-
 1
1 -
2
-
3
-
4
-
5
-
6
-
7
-
8
-
9
-
10
-
11
-
12
-
13
-
14
-
15
-
16
-
17
-
18
-
19
-
20
-
21
-
22
-
23
-
24
-
25
-
26
-
27
-
28
-
29
-
30
-
 31
31 -
 32
32 -
 33
33 -
 34
34 -
 35
35 -
 36
36 -
 37
37 -
 38
38 -
 39
39 -
 40
40 -
 41
41 -
 42
42 -
 43
43 -
 44
44 -
 45
45 -
 46
46 -
 47
47 -
 48
48 -
 49
49 -
 50
50 -
 51
51 -
52
-
53
-
54
-
55
-
56
-
57
-
58
-
59
-
60
-
61
-
62
-
63
-
64
-
65
-
66
-
67
-
68
-
69
-
70
-
71
-
72
-
73
-
74
-
75
-
76
-
77
-
78
-
79
-
80
-
81
-
82
-
83
-
84
-
85
-
86
-
87
-
88
-
89
-
90
-
91
-
92
-
93
-
94
-
95
-
96
-
97
-
98
-
99
-
100
-
101
-
102
-
103
-
104
-
105
 |
 |

TOYOTA ANNUAL REPORT 2010 39
64.5% of Toyotas non-domestic sales outside
Japan, respectively. In North America, 57.4% and
60.0% of vehicles sold in calendar 2008 and 2009
respectively were produced locally. In Europe,
60.9% and 57.0% of vehicles sold in calendar 2008
and 2009 respectively were produced locally.
Localizing production enables Toyota to locally
purchase many of the supplies and resources
used in the production process, which allows for
a better match of local currency revenues with
local currency expenses.
Toyota also enters into foreign currency
transactions and other hedging instruments to
address a portion of its transaction risk. This has
reduced, but not eliminated, the eff ects of foreign
currency exchange rate fl uctuations, which in
some years can be signifi cant. See notes 20 and
21 to the consolidated fi nancial statements for
additional information regarding the extent of
Toyotas use of derivative fi nancial instruments
to hedge foreign currency exchange rate risks.
Generally, a weakening of the Japanese yen
against other currencies has a positive eff ect
on Toyotas revenues, operating income and
net income attributable to Toyota Motor
Corporation. A strengthening of the Japanese
yen against other currencies has the opposite
eff ect. In fi scal 2009 and 2010, the Japanese yen
was on average and at the end of the fi scal year
stronger against the U.S. dollar and the euro in
comparison to the prior fi scal year. See further
discussion in the Market Risk Disclosures section
regarding Foreign Currency Exchange Rate Risk.
During fi scal 2009 and 2010, the average
exchange rate of the Japanese yen strengthened
against the major currencies including the
U.S. dollar and the euro compared to the
average exchange rate of the prior fi scal year.
The operating results excluding the impact of
currency fl uctuations described in the Results of
Operations ̶ Fiscal 2010 Compared with Fiscal
2009 and the Results of Operations ̶ Fiscal
2009 Compared with Fiscal 2008, show results of
net revenues obtained by applying the Japanese
yens average exchange rate in the previous
fi scal year to the local currency-denominated net
revenues for fi scal 2009 and 2010, respectively, as
if the value of the Japanese yen had remained
constant for the comparable periods. Results
excluding the impact of currency fl uctuations
year-on-year are not on the same basis as
Toyotas consolidated fi nancial statements and
do not conform with U.S. GAAP. Furthermore,
Toyota does not believe that these measures are
a substitute for U.S. GAAP measures. However,
Toyota believes that such results excluding the
impact of currency fl uctuations year-on-year
provide additional useful information to investors
regarding the operating performance on a local
currency basis.
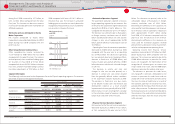
Segmentation
Toyotas most signifi cant business segment is
its automotive operations. Toyota carries out its
automotive operations as a global competitor in
the worldwide automotive market. Management
allocates resources to, and assesses the
performance of, its automotive operations as
a single business segment on a worldwide
basis. Toyota does not manage any subset of
its automotive operations, such as domestic
or overseas operations or parts, as separate
management units.
The management of the automotive
operations is aligned on a functional basis
with managers having oversight responsibility
for the major operating functions within the
segment. Management assesses fi nancial and
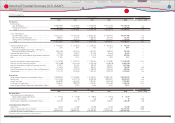
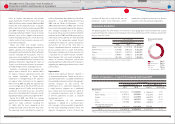
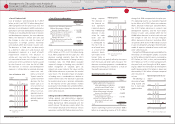
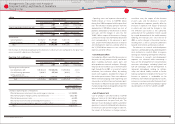
The following table sets forth Toyotas net revenues in each geographic market based on the country
location of the parent company or the subsidiaries that transacted the sale with the external customer for
the past three fi scal years.
Yen in millions
Year ended March 31,
2008 2009 2010
Japan ·················································· ¥8,418,620 ¥7,471,916 ¥7,314,813
North America ······························ 9,248,950 6,097,676 5,583,228
Europe ··············································· 3,802,814 2,889,753 2,082,671
Asia ······················································ 2,790,987 2,450,412 2,431,648
Other* ················································ 2,027,869 1,619,813 1,538,613
* Other consists of Central and South America, Oceania and Africa.
ダミー
Revenues by Market
FY2010
Japan 38.6%
North America 29.5%
Europe 11.0%
Asia 12.8%
All Other Markets 8.1%
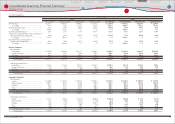
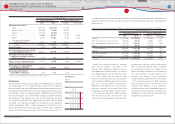
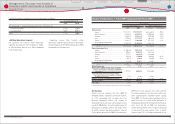
Yen in millions
Year ended March 31, 2010 vs. 2009 change
2009 2010 Amount Percentage
Net revenues:
Japan ····························································· ¥ 12,186,737 ¥ 11,220,303 ¥ (966,434) ‒7.9%
North America ·········································· 6,222,914 5,670,526 (552,388) ‒8.9%
Europe ·························································· 3,013,128 2,147,049 (866,079) ‒28.7%
Asia ································································· 2,719,329 2,655,327 (64,002) ‒2.4%
Other* ··························································· 1,882,900 1,673,861 (209,039) ‒11.1%
Intersegment elimination/
unallocated amount ························ (5,495,438) (4,416,093) 1,079,345 −
Total ····················································· ¥ 20,529,570 ¥ 18,950,973 ¥ (1,578,597) ‒7.7%
* Other consists of Central and South America, Oceania and Africa.
Geographic Breakdown
Results of Operations ̶Fiscal 2010 Compared with Fiscal 2009
non-fi nancial data such as units of sale, units of
production, market share information, vehicle
model plans and plant location costs to allocate
resources within the automotive operations.
Financial Section
Financial Section
Investor Information
Corporate Information
Special Feature
Consolidated
Performance Highlights
Business Overview
Top Messages
Management's Discussion and Analysis of
Financial Condition and Results of Operations