Toyota 2010 Annual Report Download - page 88
Download and view the complete annual report
Please find page 88 of the 2010 Toyota annual report below. You can navigate through the pages in the report by either clicking on the pages listed below, or by using the keyword search tool below to find specific information within the annual report.-
 1
1 -
2
-
3
-
4
-
5
-
6
-
7
-
8
-
9
-
10
-
11
-
12
-
13
-
14
-
15
-
16
-
17
-
18
-
19
-
20
-
21
-
22
-
23
-
24
-
25
-
26
-
27
-
28
-
29
-
30
-
31
-
32
-
33
-
34
-
35
-
36
-
37
-
38
-
39
-
40
-
41
-
42
-
43
-
44
-
45
-
46
-
47
-
48
-
49
-
50
-
51
-
52
-
53
-
54
-
55
-
56
-
57
-
58
-
59
-
60
-
61
-
62
-
63
-
64
-
65
-
66
-
67
-
68
-
69
-
70
-
71
-
72
-
73
-
74
-
75
-
76
-
77
-
 78
78 -
 79
79 -
 80
80 -
 81
81 -
 82
82 -
 83
83 -
 84
84 -
 85
85 -
 86
86 -
 87
87 -
 88
88 -
 89
89 -
 90
90 -
 91
91 -
 92
92 -
 93
93 -
 94
94 -
 95
95 -
 96
96 -
 97
97 -
 98
98 -
99
-
100
-
101
-
102
-
103
-
104
-
105
 |
 |
TOYOTA ANNUAL REPORT 2010 86
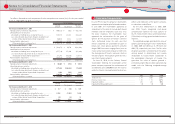
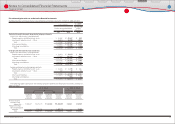
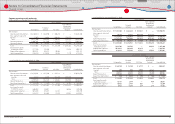
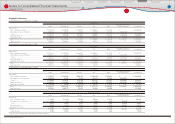
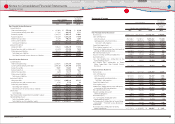
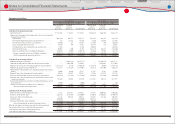
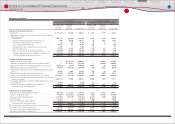
The following table summarizes the gains and losses on derivative fi nancial instruments and hedged items reported in the consolidated statement of income for the years ended March 31, 2009 and 2010:
Yen in millions U.S. dollars in millions
For the years ended March 31, For the year ended March 31,
2009 2010 2010
Gains (losses) on
derivative fi nancial
instruments
Gains (losses) on hedged
items
Gains (losses) on
derivative fi nancial
instruments
Gains (losses) on hedged
items
Gains (losses) on
derivative fi nancial
instruments
Gains (losses) on hedged
items
Derivative fi nancial instruments
designated as hedging instruments - Fair value hedge
Interest rate and currency swap agreements
Cost of fi nancing operations ·············································· ¥ (288,553) ¥ 293,637 ¥ 138,677 ¥ (135,163) $ 1,491 $ (1,453)
Interest expense ······································································· (439) 439 (265) 265 (3) 3
Undesignated derivative fi nancial instruments
Interest rate and currency swap agreements
Cost of fi nancing operations ·············································· ¥ (72,696) ¥ ̶ ¥ 77,939 ¥ ̶ $ 838 $ ̶
Foreign exchange gain (loss), net ··································· (3,016) ̶ (2,819) ̶ (30) ̶
Foreign exchange forward and option contracts
Cost of fi nancing operations ·············································· 24,183 ̶ (21,841) ̶ (235) ̶
Foreign exchange gain (loss), net ·································· 174,158 ̶ 60,599 ̶ 651 ̶
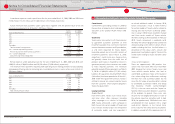
Undesignated derivative fi nancial instruments
are used to manage risks of fl uctuations in
interest rates to certain borrowing transactions
and in foreign currency exchange rates of
certain currency receivables and payables.
Toyota accounts for these derivative fi nancial
instruments as economic hedges with changes
in the fair value recorded directly into current
period earnings.
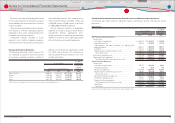
Unrealized gains or (losses) on undesignated
derivative fi nancial instruments reported in
the cost of fi nancing operations for the years
ended March 31, 2008, 2009 and 2010 were
¥(67,991) million, ¥(80,298) million and ¥71,538
million ($769 million) those reported in foreign
gain (loss), net were ¥45,670 million, ¥(33,578)
million and ¥(26,476) million ($(285) million),
respectively.
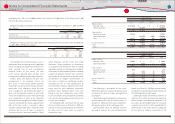
Toyota corrected the gains or losses on
derivative fi nancial instruments and hedged
items disclosed for the year ended March 31,
2009 as a result of changes to information
gathered from certain subsidiaries. These
adjustments do not have a material impact on
Toyotas consolidated fi nancial statements.
Credit risk related contingent features
Toyota enters into International Swaps and
Derivatives Association Master Agreements
with counterparties. These Master Agreements
contain a provision requiring either Toyota or
the counterparty to settle the contract or to post
assets to the other party in the event of a ratings
downgrade below a specifi ed threshold.
The aggregate fair value amount of derivative
fi nancial instruments that contain credit risk
related contingent features that are in a net
liability position as of March 31, 2010 is ¥63,445
million ($682 million). The aggregate fair value
amount of assets that are already posted as of
March 31, 2010 is ¥9,469 million ($102 million).
If the ratings of Toyota decline below specifi ed
thresholds, the maximum amount of assets to
be posted or for which Toyota could be required
to settle the contracts is ¥63,445 million ($682
million) as of March 31, 2010.
Financial Section
Financial Section
Investor Information
Corporate Information
Special Feature
Consolidated
Performance Highlights
Business Overview
Top Messages
Notes to Consolidated Financial Statements