Toyota 2010 Annual Report Download - page 14
Download and view the complete annual report
Please find page 14 of the 2010 Toyota annual report below. You can navigate through the pages in the report by either clicking on the pages listed below, or by using the keyword search tool below to find specific information within the annual report.-
 1
1 -
2
-
3
-
 4
4 -
 5
5 -
 6
6 -
 7
7 -
 8
8 -
 9
9 -
 10
10 -
 11
11 -
 12
12 -
 13
13 -
 14
14 -
 15
15 -
 16
16 -
 17
17 -
 18
18 -
 19
19 -
 20
20 -
 21
21 -
 22
22 -
 23
23 -
 24
24 -
25
-
26
-
27
-
28
-
29
-
30
-
31
-
32
-
33
-
34
-
35
-
36
-
37
-
38
-
39
-
40
-
41
-
42
-
43
-
44
-
45
-
46
-
47
-
48
-
49
-
50
-
51
-
52
-
53
-
54
-
55
-
56
-
57
-
58
-
59
-
60
-
61
-
62
-
63
-
64
-
65
-
66
-
67
-
68
-
69
-
70
-
71
-
72
-
73
-
74
-
75
-
76
-
77
-
78
-
79
-
80
-
81
-
82
-
83
-
84
-
85
-
86
-
87
-
88
-
89
-
90
-
91
-
92
-
93
-
94
-
95
-
96
-
97
-
98
-
99
-
100
-
101
-
102
-
103
-
104
-
105
 |
 |
TOYOTA ANNUAL REPORT 2010 12
TOYOTA ANNUAL REPORT 2010
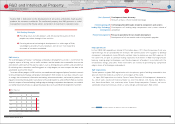
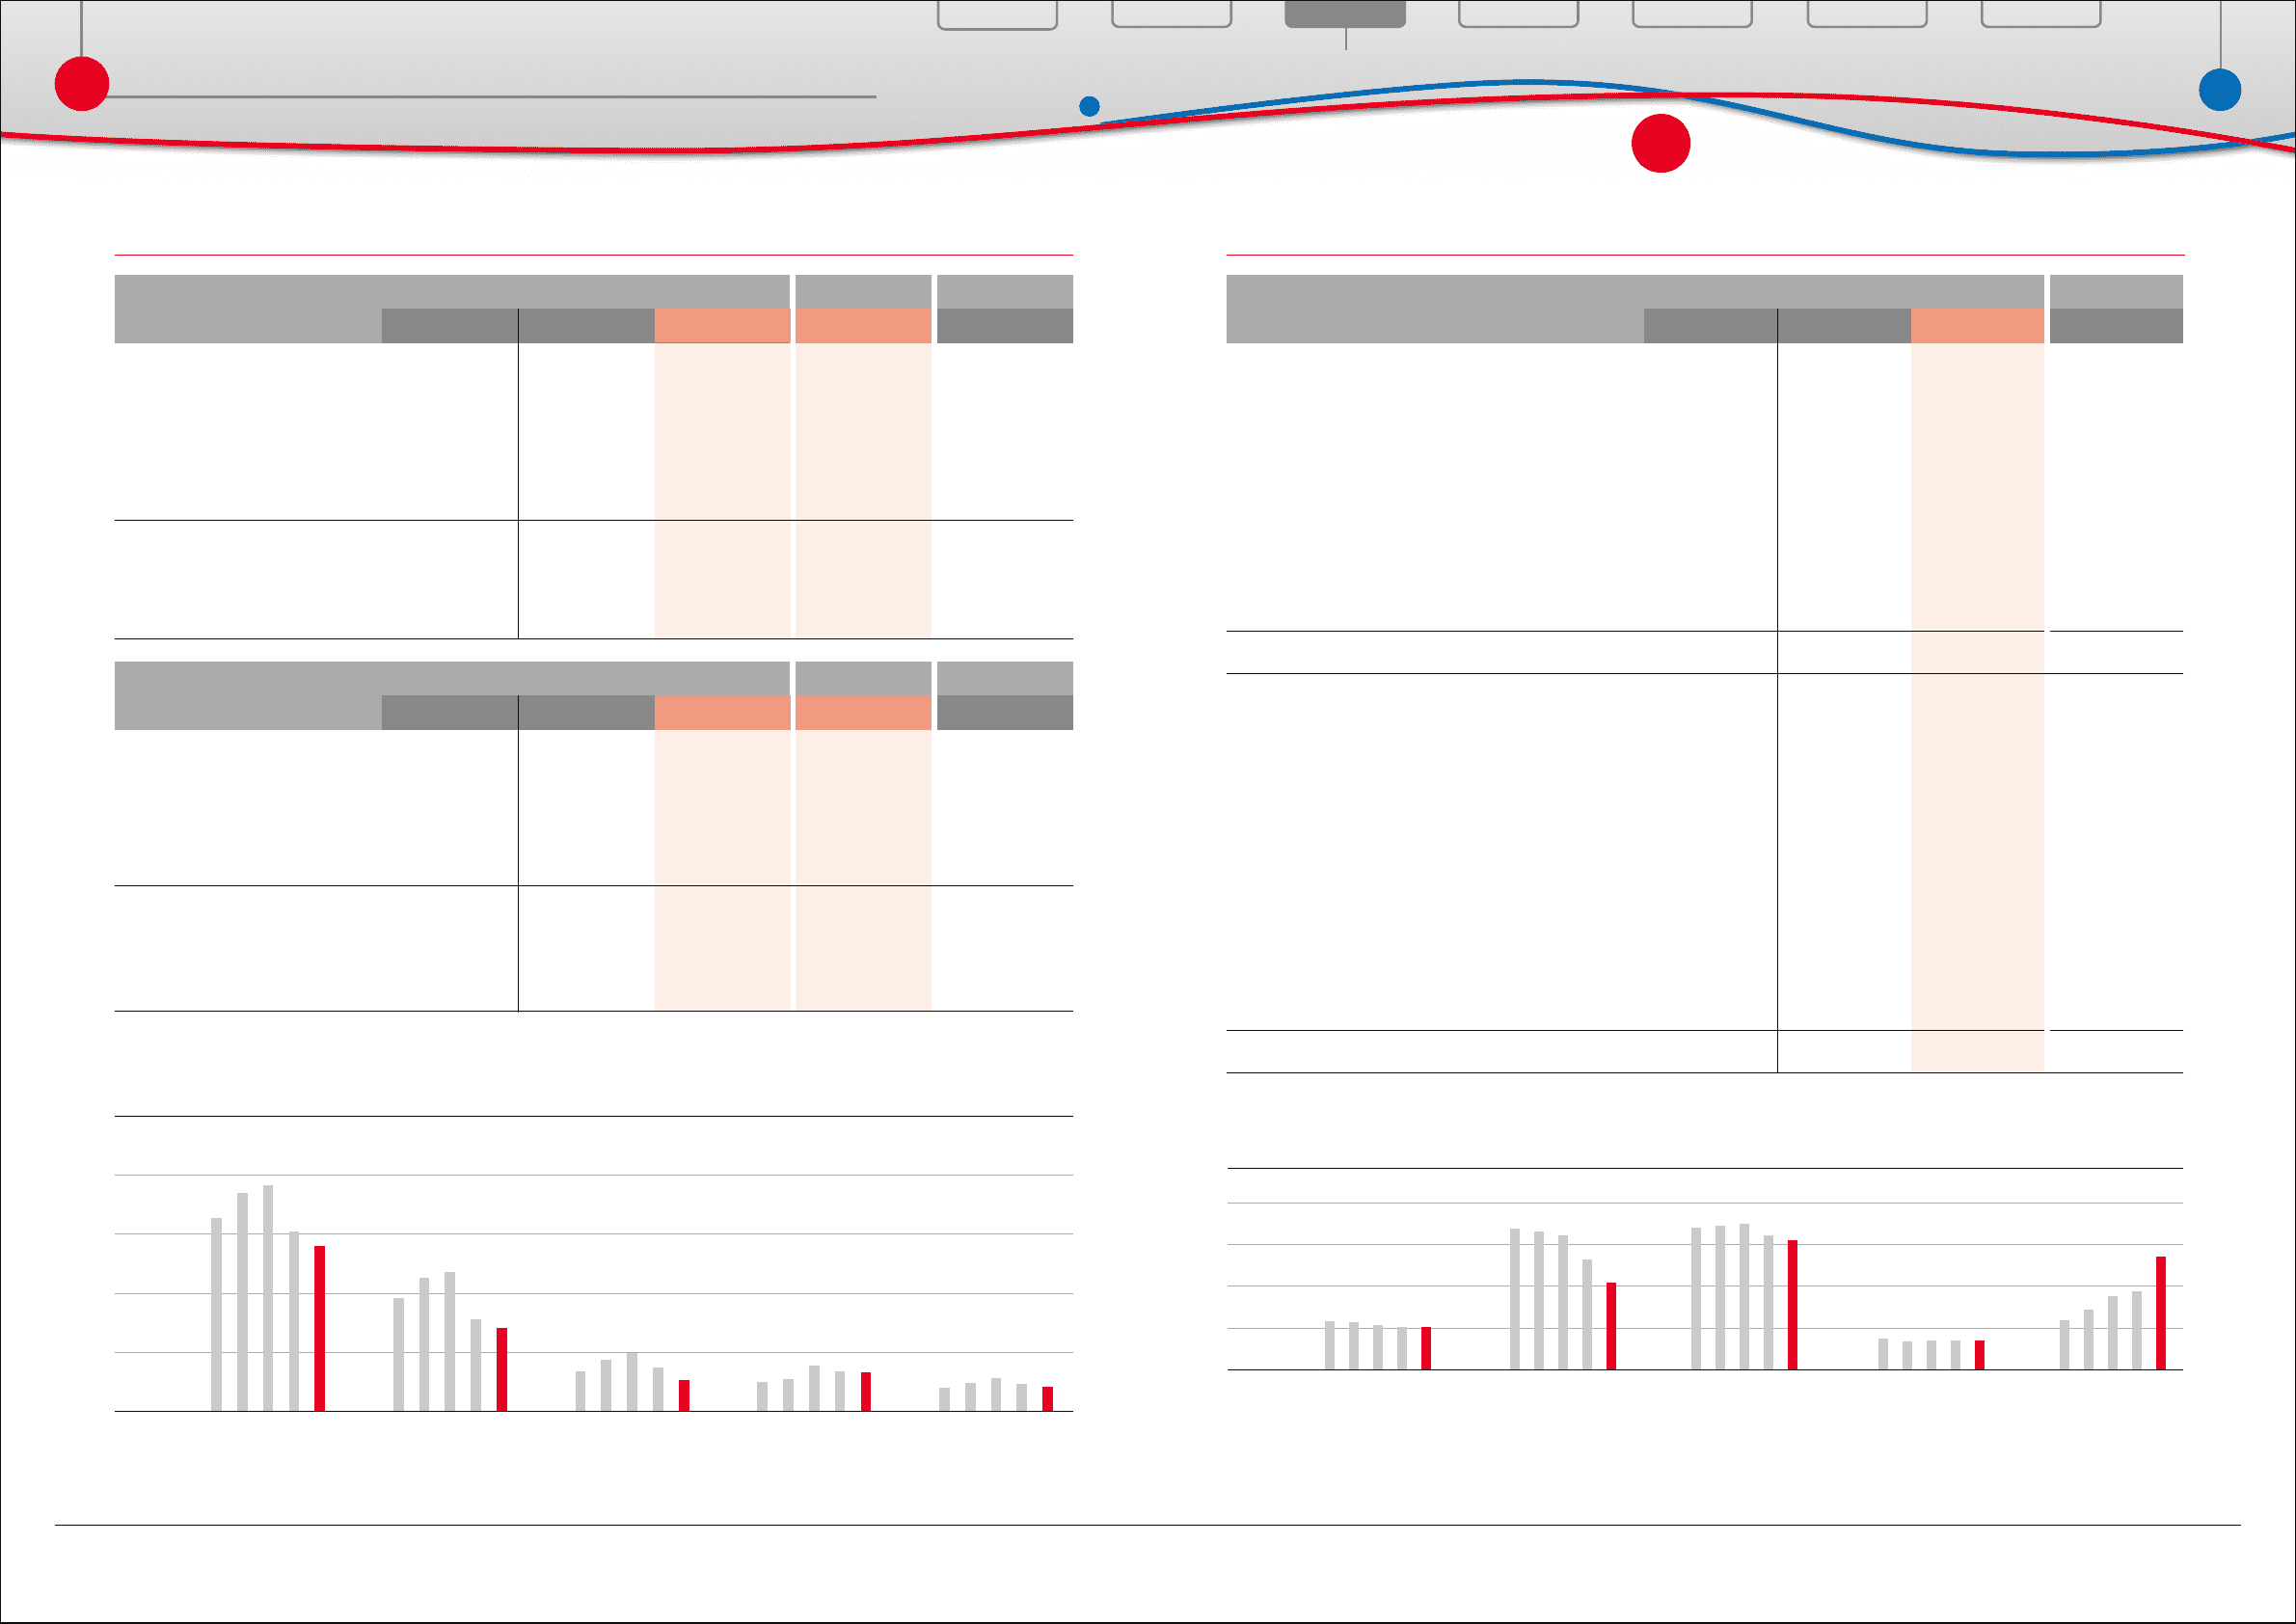
■ Consolidated Performance (U.S. GAAP)
% change
2010 vs. 2009
U.S. dollars* in millions
2010
Yen in millions
2009 2010
2008
2010 vs. 2009
2010
2009 2010
2008
For the Year:
Net Revenues
Operating Income (Loss)
Net Income (Loss)
ROE
............................................
......................
.....................................
..................................................................
At Year-End:
Total Assets
Shareholders’ Equity
.................................................
..............................
-7.7
̶
̶
̶
+4.4
+3.0
̶
-55.0
+3.0
+20.0
+20.0
$203,687
1,586
2,251
̶
$326,196
111,347
$0.72
0.48
35.51
$40.25
$138,787
¥20,529,570
(461,011)
(436,937)
- 4.0%
¥29,062,037
10,061,207
¥ (139.13)
100.00
3,208.41
¥3,120
¥10,757,752
¥18,950,973
147,516
209,456
2.1%
¥30,349,287
10,359,723
¥ 66.79
45.00
3,303.49
¥3,745
¥12,912,751
¥26,289,240
2,270,375
1,717,879
14.5%
¥32,458,320
11,869,527
¥540.65
140.00
3,768.97
¥4,970
¥17,136,548
Per Share Data:
Net Income (Loss) (Basic)
Annual Cash Dividends
Shareholders' Equity
......................
.......................
..............................
Stock Information (March 31):
Stock Price ....................................................
.....
* U.S. dollar amounts have been translated at the rate of ¥93.04=US$1, the approximate current exchange rate at March 31, 2010.
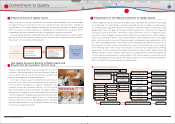
■ Net Revenues by Regions
Japan North America Europe Asia Other Regions
0
4,000
8,000
12,000
16,000
(¥ Billion)
06 07 08 09 10 06 07 08 09 10 06 07 08 09 10 06 07 08 09 10 06 07 08 09 10FY
Note: Fiscal years ended March 31
■ Consolidated Vehicle Production and Sales
-7.0
+2.0
+13.4
-10.2
+7.8
-3.2
-18.7
-37.3
+11.2
-9.7
-5.2
-19.2
+8.3
-17.2
-3.9
-36.2
-23.1
-19.3
4,255
2,796
919
482
947
151
130
167
3,956
2,853
1,042
433
1,021
146
106
105
2,163
5,074
2,098
858
979
231
251
184
466
7
7,051 6,809
1,945
5,622
2,212
1,062
905
279
261
289
606
8
7,567 7,237
5,160
3,387
1,268
711
961
150
149
148
8,547
2,188
6,725
2,958
1,284
956
320
289
314
597
7
8,913
Vehicle Production by Region:
Japan
Overseas Total
North America
Europe
Asia
Central and South America
Oceania
Africa
Japan
Overseas Total
North America
Europe
Asia
Central and South America
Oceania
Africa
Middle East
Other
.................................................................................................
................................................................................
...........................................................................
..........................................................................................
................................................................................................
...................................................
........................................................................................
.............................................................................................
.................................................................................
............................................................................................
Consolidated Total
Vehicle Sales by Region:
% change
2010 vs. 2009
Thousands of units
2009 2010
2008
-3.4
-4.4
.......................................................................
Consolidated Total .......................................................................
% changeU.S. dollars* Yen
Market Capitalization
(Yen in millions, U.S. dollars in millions)
Japan United States Europe Asia China
0
5,000
10,000
15,000
20,000
(Thousands of units)
0908070605 0908070605 0908070605 0908070605 0908070605
CY
Source: Toyota Motor Corporation
Note: Market definitions Europe: Germany, France, the United Kingdom, Italy, Spain, the Netherlands, Belgium, Portugal, Denmark, Greece, Ireland, Sweden, Austria, Finland, Switzerland, Norway, Poland,
Hungary, and the Czech Republic
Asia: Indonesia, Thailand, the Philippines, Malaysia, Singapore, Vietnam, Taiwan, South Korea and Brunei Darussalam
Japan: minivehicles included
■ Principal Market Data: Automotive Market (Sales)
Special Feature
Financial Section
Investor Information
Corporate Information
Special Feature
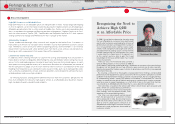
Top Messages Business Overview
Consolidated Performance Highlights
Consolidated Performance Highlights
Consolidated
Performance Highlights