Toyota 2010 Annual Report Download - page 38
Download and view the complete annual report
Please find page 38 of the 2010 Toyota annual report below. You can navigate through the pages in the report by either clicking on the pages listed below, or by using the keyword search tool below to find specific information within the annual report.-
 1
1 -
2
-
3
-
4
-
5
-
6
-
7
-
8
-
9
-
10
-
11
-
12
-
13
-
14
-
15
-
16
-
17
-
18
-
19
-
20
-
21
-
22
-
23
-
24
-
25
-
26
-
27
-
 28
28 -
 29
29 -
 30
30 -
 31
31 -
 32
32 -
 33
33 -
 34
34 -
 35
35 -
 36
36 -
 37
37 -
 38
38 -
 39
39 -
 40
40 -
 41
41 -
 42
42 -
 43
43 -
 44
44 -
 45
45 -
 46
46 -
 47
47 -
 48
48 -
49
-
50
-
51
-
52
-
53
-
54
-
55
-
56
-
57
-
58
-
59
-
60
-
61
-
62
-
63
-
64
-
65
-
66
-
67
-
68
-
69
-
70
-
71
-
72
-
73
-
74
-
75
-
76
-
77
-
78
-
79
-
80
-
81
-
82
-
83
-
84
-
85
-
86
-
87
-
88
-
89
-
90
-
91
-
92
-
93
-
94
-
95
-
96
-
97
-
98
-
99
-
100
-
101
-
102
-
103
-
104
-
105
 |
 |
TOYOTA ANNUAL REPORT 2010 36
TOYOTA ANNUAL REPORT 2010
The business segments of Toyota include
automotive operations, fi nancial services
operations and all other operations. Automotive
operations are Toyotas most signifi cant business
segment, accounting for 89% of Toyotas total
revenues before the elimination of intersegment
revenues for fi scal 2010. Toyotas primary markets
based on vehicle unit sales for fi scal 2010 were
Japan (30%), North America (29%), Europe (12%)
and Asia (14%). During fi scal 2010, as a result
of announcements of recalls and other safety
measures for several models of vehicles in several
countries, the number of recalls and other safety
measures increased. These recalls and other
safety measures have impacted the fi nancial
results of the automotive and fi nancial services
operations and led to a number of claims, lawsuits
and government investigations. As a result of the
foregoing, the fi scal 2010 operating results of the
automotive operations were principally aff ected
by factors including but not limited to the accrued
costs related to the recalls and other safety
measures announced in fi scal 2010, a temporary
decrease in sales mainly in North America and
additional costs resulting from a change in the
estimation model of expenses related to future
recalls and other safety measures. In fi scal 2010,
Toyota has employed an estimation model for
recalls and other safety measures which takes
into account Toyotas historical experience and
individual occurrences of recalls and other safety
measures to accrue recall costs at the time of
vehicle sale. In addition, as a result of the above,
the fi scal 2010 operating results of the fi nancial
services operations were principally aff ected by
the evaluation for credit losses and residual value
losses at March 31, 2010. Not all of the impacts
described above are fi nancially signifi cant or
are able to be precisely measured. Toyota has
included in the following discussion and analysis,
where relevant, signifi cant impacts of these
items.
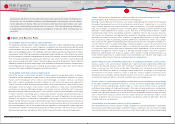
Automotive Market Environment
The worldwide automotive market is highly
competitive and volatile. The demand for
automobiles is aff ected by a number of factors
including social, political and general economic
conditions; introduction of new vehicles and
technologies; and costs incurred by customers to
purchase and operate vehicles. These factors can
cause consumer demand to vary substantially in
diff erent geographic markets and for diff erent
types of automobiles.
The automotive industry generally experienced
diffi cult market conditions during fi scal 2010 due
to changes in market demand resulting from
a shift in consumer preference towards small
and low-price vehicles, despite the continuous
growth in China, India and other emerging
countries and the eff ects of government stimulus
packages in developed countries.
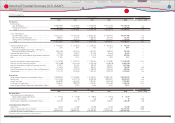
The following table sets forth Toyotas
consolidated vehicle unit sales by geographic
market based on location of customers for the
past three fi scal years.
During fi scal
2009, Toyotas
consolidated ve-
hicle unit sales in
Japan decreased
due to weak mar-
ket conditions as
compared to the
prior fi scal year.
During fi scal 2010,
sales in Japan in-
creased as com-
pared to the prior
fi scal year refl ect-
ing frequent in-
troduction of new
products and sales eff orts of domestic dealers on
the sales of new products. In fi scal 2010, Toyota
and Lexus brands market share excluding mini-
vehicles was 48.2%, and Toyotas market share
(including Daihatsu and Hino brands) including
mini-vehicles was 44.3%, and both market shares
represented record highs. Overseas vehicle unit
sales decreased during fi scal 2009 and 2010,
each compared to the prior fi scal year. During
fi scal 2009, overseas vehicle unit sales decreased,
particularly in North America and Europe, where
the contraction of automotive markets was
especially pronounced. During fi scal 2010, total
overseas vehicle unit sales decreased, particularly
in Europe, despite an increase in Asia.
Toyotas share of total vehicle unit sales in
each market is infl uenced by the quality, safety,
reliability, price, design, performance, economy
and utility of Toyotas vehicles compared with
those off ered by other manufacturers. The timely
introduction of new or redesigned vehicles is also
an important factor in satisfying customer needs.
Toyotas ability to satisfy changing customer
preferences can aff ect its revenues and earnings
signifi cantly.
The profi tability of Toyotas automotive
operations is aff ected by many factors. These
factors include:
vehicle unit sales volumes,
the mix of vehicle models and options sold,
the level of parts and service sales,
the levels of price discounts and other sales
incentives and marketing costs,
the cost of customer warranty claims and
other customer satisfaction actions,
the cost of research and development and
other fi xed costs,
the prices of raw materials,
the ability to control costs,
All fi nancial information discussed in this section is derived from Toyotas consolidated fi nancial
statements that appear elsewhere in this annual report. The fi nancial statements have been prepared
in conformity with accounting principles generally accepted in the United States of America.
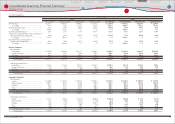
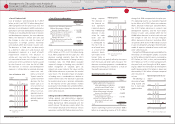
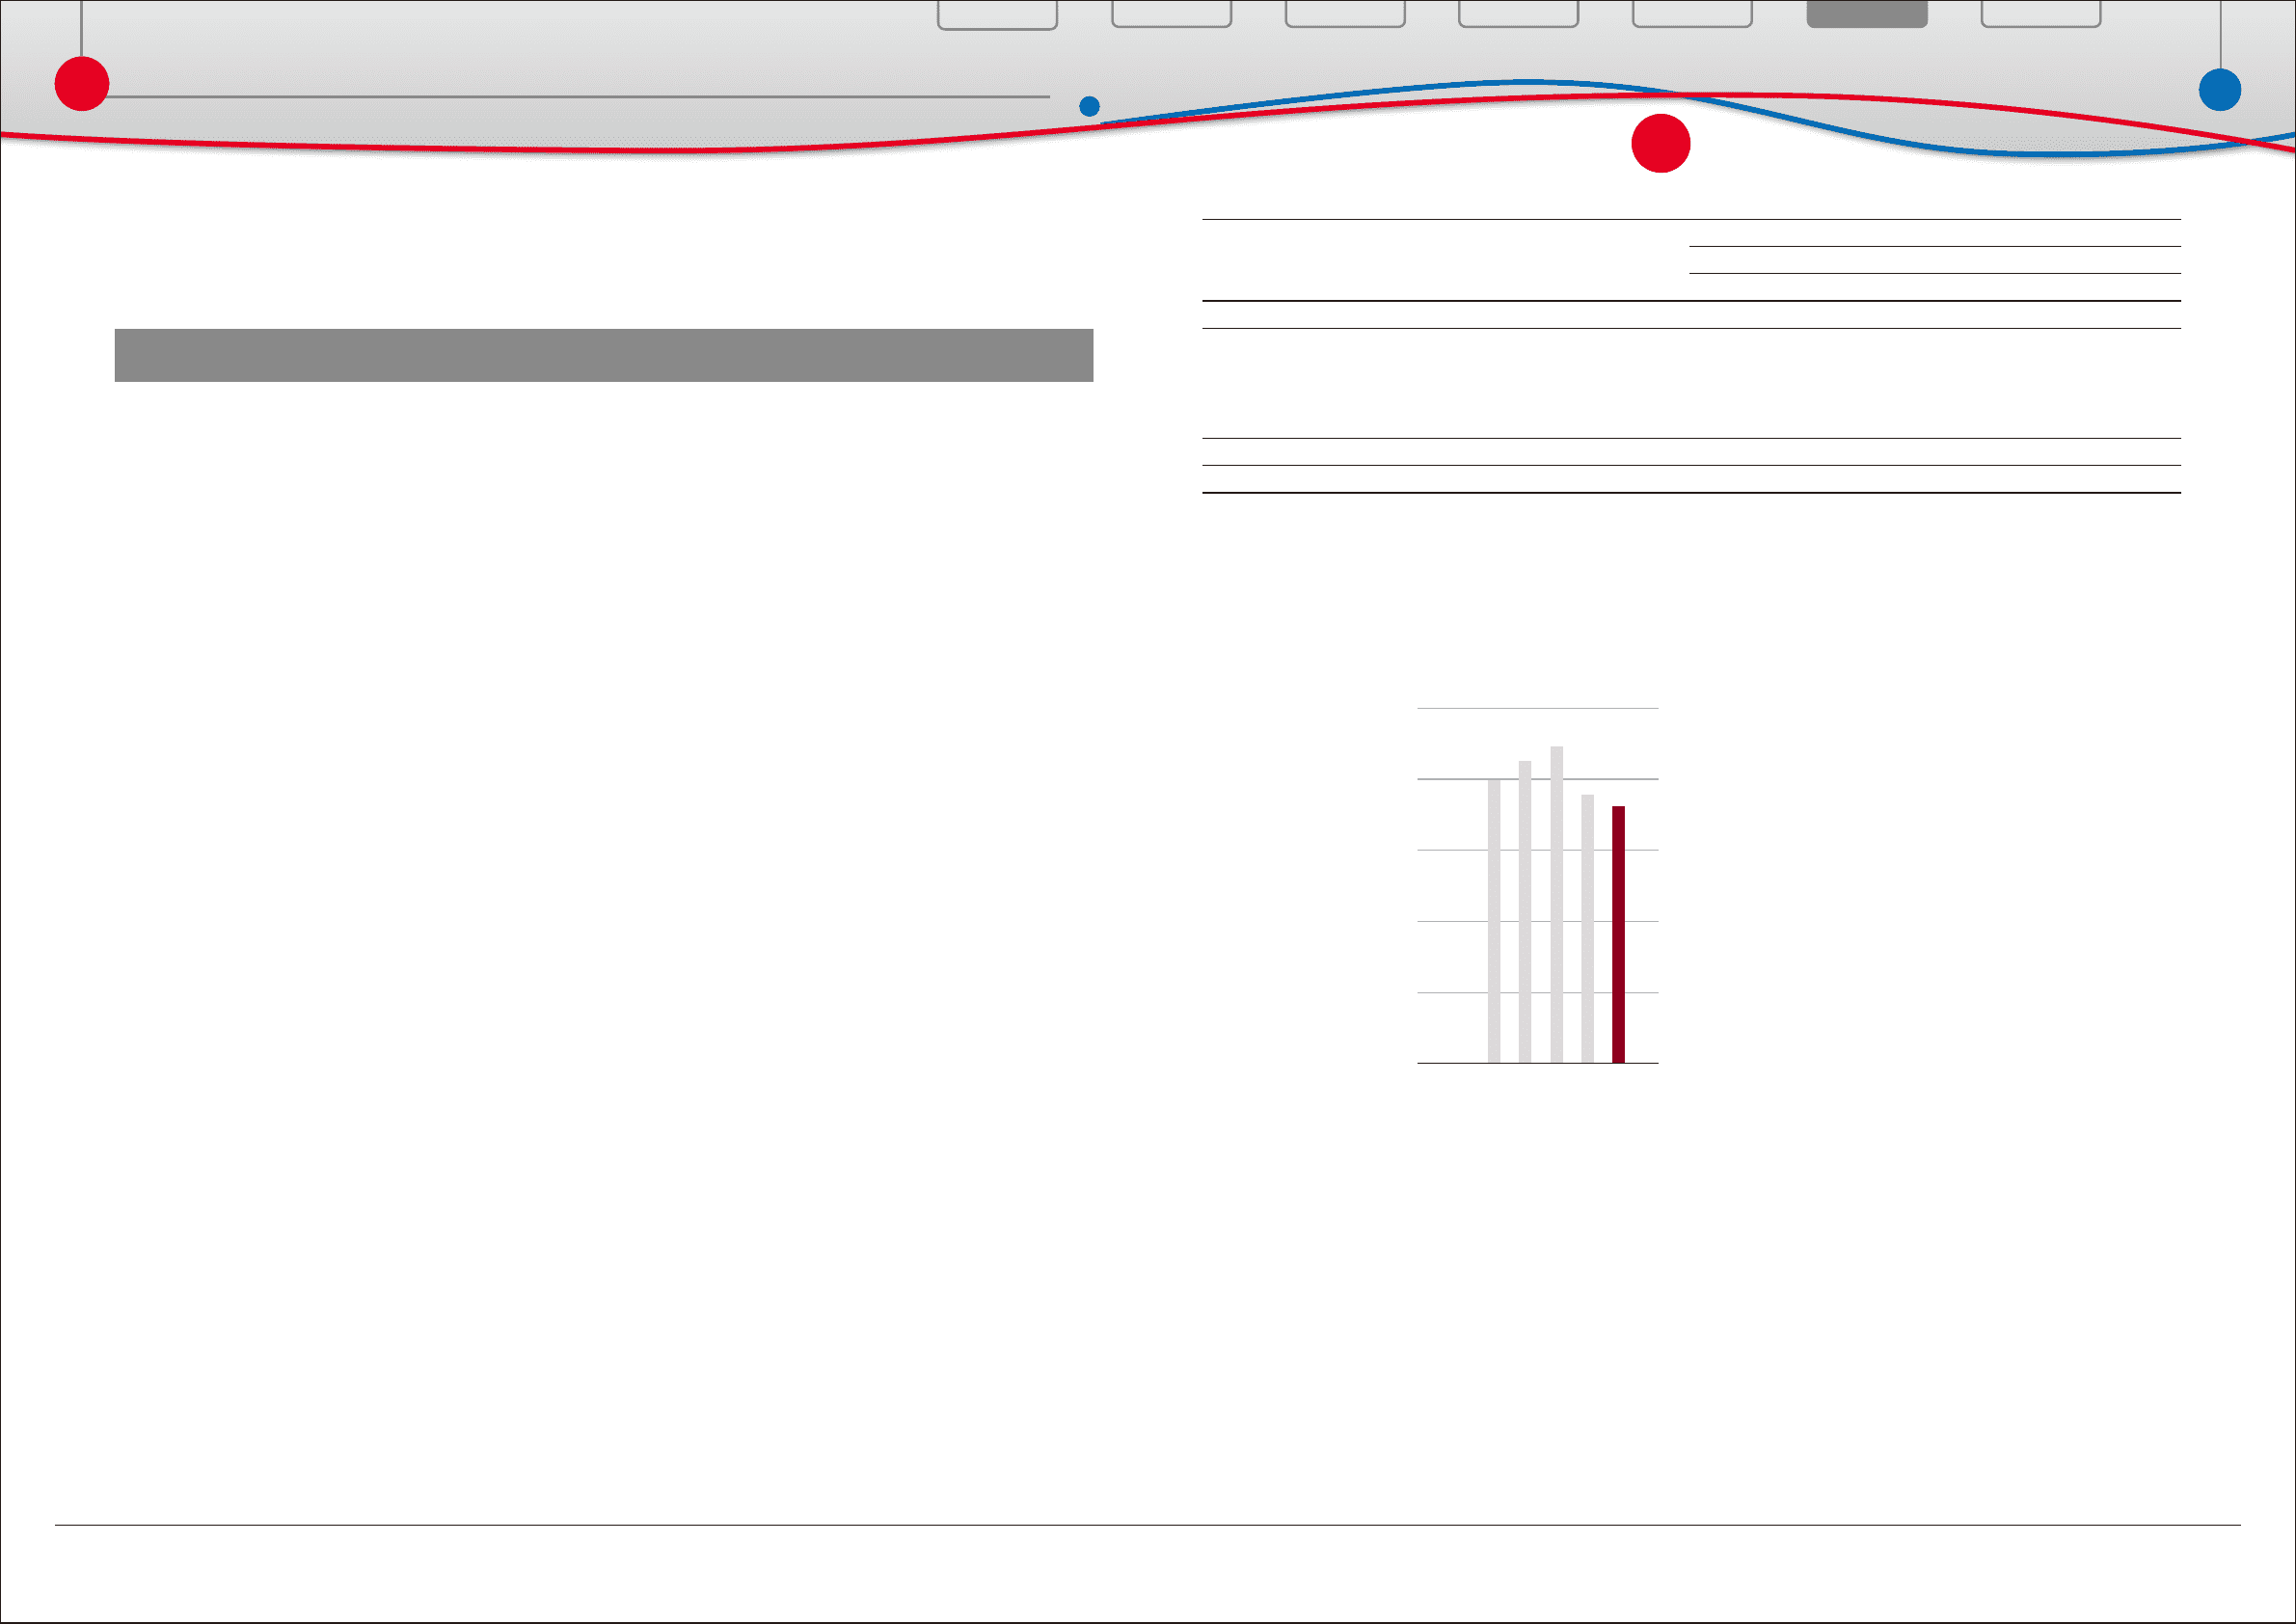
Consolidated Vehicle Sales
0
2,000
4,000
6,000
8,000
10,000
(Thousands of units)
7080 1060FY 09
(Thousands of units)
Year ended March 31,
2008 2009 2010
Japan ·············································································································· 2,188 1,945 2,163
North America ·························································································· 2,958 2,212 2,098
Europe ··········································································································· 1,284 1,062 858
Asia ·················································································································· 956 905 979
Other* ············································································································ 1,527 1,443 1,139
Overseas total···························································································· 6,725 5,622 5,074
Total ················································································································ 8,913 7,567 7,237
* Other consists of Central and South America, Oceania, Africa and the Middle East, etc.
Overview
Financial Section
Financial Section
Investor Information
Corporate Information
Special Feature
Consolidated
Performance Highlights
Business Overview
Top Messages
Management's Discussion and Analysis of
Financial Condition and Results of Operations