Toyota 2010 Annual Report Download - page 100
Download and view the complete annual report
Please find page 100 of the 2010 Toyota annual report below. You can navigate through the pages in the report by either clicking on the pages listed below, or by using the keyword search tool below to find specific information within the annual report.-
 1
1 -
2
-
3
-
4
-
5
-
6
-
7
-
8
-
9
-
10
-
11
-
12
-
13
-
14
-
15
-
16
-
17
-
18
-
19
-
20
-
21
-
22
-
23
-
24
-
25
-
26
-
27
-
28
-
29
-
30
-
31
-
32
-
33
-
34
-
35
-
36
-
37
-
38
-
39
-
40
-
41
-
42
-
43
-
44
-
45
-
46
-
47
-
48
-
49
-
50
-
51
-
52
-
53
-
54
-
55
-
56
-
57
-
58
-
59
-
60
-
61
-
62
-
63
-
64
-
65
-
66
-
67
-
68
-
69
-
70
-
71
-
72
-
73
-
74
-
75
-
76
-
77
-
78
-
79
-
80
-
81
-
82
-
83
-
84
-
85
-
86
-
87
-
88
-
89
-
 90
90 -
 91
91 -
 92
92 -
 93
93 -
 94
94 -
 95
95 -
 96
96 -
 97
97 -
 98
98 -
 99
99 -
 100
100 -
 101
101 -
 102
102 -
 103
103 -
 104
104 -
 105
105
 |
 |
TOYOTA ANNUAL REPORT 2010 98
In accordance with U.S. GAAP, Toyota classifi es
fair value into three levels of input as follows
which are used to measure it.
Level 1: Quoted prices in active markets for
identical assets or liabilities
Level 2: Quoted prices for similar assets or
liabilities in active markets; quoted
prices for identical or similar assets
or liabilities in markets that are not
active; inputs other than quoted prices
that are observable for the assets or
liabilities
Level 3: Unobservable inputs for assets or
liabilities
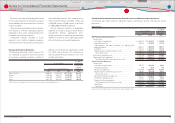
Yen in millions
March 31, 2009
Level 1 Level 2 Level 3 Total
Assets
Cash equivalents ································································· ¥ 1,473,407 ¥ 115,339 ¥ ̶ ¥ 1,588,746
Marketable securities and
other securities investments ··································· 2,273,294 187,236 19,581 2,480,111
Derivative fi nancial instruments ̶ 369,572 17,958 387,530
Total ······················································································ ¥ 3,746,701 ¥ 672,147 ¥ 37,539 ¥ 4,456,387
Liabilities
Derivative fi nancial instruments ································· ¥ ̶ ¥ (427,109) ¥ (23,692) ¥ (450,801)
Total ······················································································ ¥ ̶ ¥ (427,109) ¥ (23,692) ¥ (450,801)
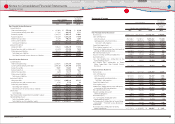
Yen in millions
March 31, 2010
Level 1 Level 2 Level 3 Total
Assets
Cash equivalents ································································· ¥ 677,442 ¥ 69,702 ¥ ̶ ¥ 747,144
Time deposits ········································································ ̶ 173,500 ̶ 173,500
Marketable securities and
other securities investments
Government bonds ················································· 2,654,829 ̶ ̶ 2,654,829
Common stocks ························································ 852,775 ̶ ̶ 852,775
Other ··············································································· 37,296 370,933 13,134 421,363
Derivative fi nancial instruments ································· ̶ 349,556 19,437 368,993
Total ······················································································ ¥ 4,222,342 ¥ 963,691 ¥ 32,571 ¥ 5,218,604
Liabilities
Derivative fi nancial instruments ································· ¥ ̶ ¥ (259,184) ¥ (13,545) ¥ (272,729)
Total ······················································································ ¥ ̶ ¥ (259,184) ¥ (13,545) ¥ (272,729)
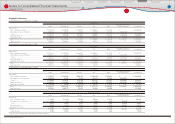
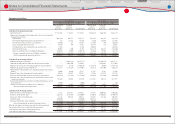
U.S. dollars in millions
March 31, 2010
Level 1 Level 2 Level 3 Total
Assets
Cash equivalents ································································· $ 7,281 $ 749 $ ̶ $ 8,030
Time deposits ········································································ ̶ 1,865 ̶ 1,865
Marketable securities and
other securities investments
Government bonds ················································· 28,534 ̶ ̶ 28,534
Common stocks ························································ 9,166 ̶ ̶ 9,166
Other ··············································································· 401 3,987 141 4,529
Derivative fi nancial instruments ································· ̶ 3,757 209 3,966
Total ······················································································ $ 45,382 $ 10,358 $ 350 $ 56,090
Liabilities
Derivative fi nancial instruments ································· $ ̶ $ (2,786) $ (146) $ (2,932)
Total ······················································································ $ ̶ $ (2,786) $ (146) $ (2,932)
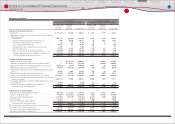
Cash equivalents and time deposits
Cash equivalents include money market funds
and other investments with original maturities
of three months or less. Time deposits include
negotiable certifi cate of deposit with original
maturities over three months. These are highly
liquid investments, and quoted market prices
are used to determine the fair value of these
investments.
Marketable securities and other securities
investments
Marketable securities and other securities
investments include government bonds,
common stocks and other investments. As of
March 31, 2010, government bonds include
76% of Japanese government bonds, and 24%
of U.S. and European government bonds. As
of March 31, 2010, listed stocks on Japanese
stock market represent 88% of common stocks.
Toyota uses quoted market prices for identical
assets to measure fair value of these securities.
Other includes primarily commercial paper.
Generally, Toyota uses quoted market prices
for similar assets or quoted non-active market
prices for identical assets to measure fair value
of these securities. Marketable securities and
other securities investments classifi ed as Level 3
primarily included retained interests in securitized
fi nancial receivables, which are measured at fair
value using assumptions such as interest rate,
loss severity and other factors.
Derivative fi nancial instruments
See note 20 to the consolidated fi nancial
statements about derivative fi nancial instruments.
Toyota estimates the fair value of derivative
fi nancial instruments using industry-standard
valuation models that require observable inputs
including interest rates and foreign exchange
rates, and the contractual terms. The usage of
these models does not require signifi cant
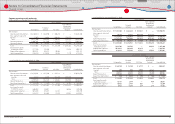
The following is description of the assets and liabilities measured at fair value, information about the
valuation techniques used to measure fair value, key inputs and signifi cant assumptions:
The following table summarizes the fair values of the assets and liabilities measured at fair value on a
recurring basis at March 31, 2009 and 2010:
Financial Section
Financial Section
Investor Information
Corporate Information
Special Feature
Consolidated
Performance Highlights
Business Overview
Top Messages
Notes to Consolidated Financial Statements
Fair value measurements:
26