Toyota 2010 Annual Report Download - page 77
Download and view the complete annual report
Please find page 77 of the 2010 Toyota annual report below. You can navigate through the pages in the report by either clicking on the pages listed below, or by using the keyword search tool below to find specific information within the annual report.-
 1
1 -
2
-
3
-
4
-
5
-
6
-
7
-
8
-
9
-
10
-
11
-
12
-
13
-
14
-
15
-
16
-
17
-
18
-
19
-
20
-
21
-
22
-
23
-
24
-
25
-
26
-
27
-
28
-
29
-
30
-
31
-
32
-
33
-
34
-
35
-
36
-
37
-
38
-
39
-
40
-
41
-
42
-
43
-
44
-
45
-
46
-
47
-
48
-
49
-
50
-
51
-
52
-
53
-
54
-
55
-
56
-
57
-
58
-
59
-
60
-
61
-
62
-
63
-
64
-
65
-
66
-
 67
67 -
 68
68 -
 69
69 -
 70
70 -
 71
71 -
 72
72 -
 73
73 -
 74
74 -
 75
75 -
 76
76 -
 77
77 -
 78
78 -
 79
79 -
 80
80 -
 81
81 -
 82
82 -
 83
83 -
 84
84 -
 85
85 -
 86
86 -
 87
87 -
88
-
89
-
90
-
91
-
92
-
93
-
94
-
95
-
96
-
97
-
98
-
99
-
100
-
101
-
102
-
103
-
104
-
105
 |
 |

TOYOTA ANNUAL REPORT 2010 75
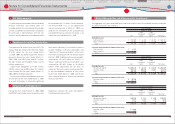
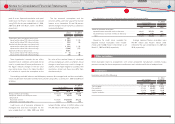
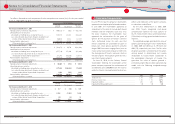
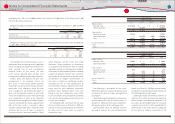
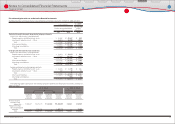
Investments in and transactions with affi liated companies -
Summarized fi nancial information for affi liated co mpanies accounted for by the equity method is shown below:
Yen in millions
U.S. dollars
in millions
March 31, March 31,
2009 2010 2010
Current assets ··················································································································· ¥ 6,400,685 ¥ 8,034,546 $ 86,356
Noncurrent assets ·········································································································· 9,438,905 9,300,307 99,960
Total assets················································································································· ¥ 15,839,590 ¥ 17,334,853 $ 186,316
Current liabilities ············································································································· ¥ 4,216,956 ¥ 5,056,178 $ 54,344
Long-term liabilities and noncontrolling interest ········································ 5,740,150 5,981,054 64,285
Affi liated companies accounted for by the equity method
shareholders equity ····································································································· 5,882,484 6,297,621 67,687
Total liabilities and shareholders equity ······················································· ¥ 15,839,590 ¥ 17,334,853 $ 186,316
Toyotas share of affi liated companies accounted for by the equity
method shareholders equity ·············································································· ¥ 1,810,106 ¥ 1,867,440 $ 20,071
Number of affi liated companies accounted for by the equity method
at end of period ·················································································································
56 56
Yen in millions
U.S. dollars
in millions
For the years ended March 31,
For the year
ended
March 31,
2008 2009 2010 2010
Net revenues ·················································································· ¥ 26,511,831 ¥ 23,149,968
¥ 20,599,586
$ 221,406
Gross profi t ······················································································ ¥ 3,081,366 ¥ 2,034,617
¥ 2,269,109
$ 24,389
Net income attributable to affi liated companies
accounted for by the equity method ···························· ¥ 870,528 ¥ 13,838
¥ 317,017
$ 3,407
Entities comprising a signifi cant portion of
Toyotas investment in affi liated companies
include Denso Corporation; Toyota Industries
Corporation; Aisin Seiki Co., Ltd.; Aioi Insurance
Co., Ltd.; and Toyota Tsusho Corporation.
Aioi Insurance Co., Ltd. ceased to be an
affi liated company accounted for by the equity
method of Toyota Motor Corporation as of April
1, 2010, due to the business integration through
a share-for-share exchange.
Certain affi liated companies accounted for
by the equity method with carrying amounts
of ¥1,417,896 million and ¥1,439,090 million
($15,467 million) at March 31, 2009 and 2010,
respectively, were quoted on various established
markets at an aggregate value of ¥1,127,976
million and ¥1,711,957 million ($18,400 million),
respectively. For the year ended March 31,
2010, Toyota recognized an impairment loss
on a certain investment in affi liated company
accounted for by the equity method of ¥63,575
million ($683 million), which is included in
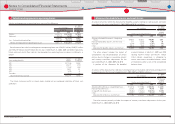
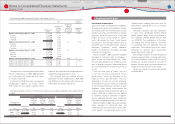
Account balances and transactions with affi liated companies are presented below:
Yen in millions
U.S. dollars
in millions
March 31, March 31,
2009 2010 2010
Trade accounts and notes receivable, and other receivables ················ ¥159,821 ¥274,189 $2,947
Accounts payable and other payables ······························································· 363,954 597,796 6,425
Yen in millions
U.S. dollars
in millions
For the years ended March 31,
For the year
ended
March 31,
2008 2009 2010 2010
Net revenues ·················································································· ¥1,693,969 ¥1,585,814 ¥1,600,365 $17,201
Purchases·························································································· 4,525,049 3,918,717 3,943,648 42,387
Dividends from affi liated companies accounted
for by the equity method for the years ended
March 31, 2008, 2009 and 2010 were ¥76,351
million, ¥114,409 million and ¥82,149 million
($883 million), respectively.
Toyota does not have any signifi cant related
party transactions other than transactions with
affi liated companies in the ordinary course of
business.
Variable Interest Entities
Toyota enters into securitization transactions
using special-purpose entities, that are
considered variable interest entities (VIEs).
Although the fi nance receivables related to
securitization transactions have been legally
sold to the VIEs, Toyota holds variable interests
in certain VIEs that are expected to absorb a
majority of the VIEs expected losses, receive a
majority of the VIEs expected residual returns,
or both. As a result, Toyota is considered the
primary benefi ciary of certain VIEs and therefore
consolidates certain VIEs except for QSPEs.
The consolidated securitization VIEs have
¥366,886 million ($3,943 million) in retail fi nance
receivables, ¥20,581 million ($221 million) in
restricted cash and ¥363,369 million ($3,906
million) in secured debt. Risks to which Toyota
is exposed including credit, interest rate, and/or
prepayment risks are not incremental compared
with the situation before Toyota enters into
securitization transactions.
Certain joint ventures in which Toyota has
invested are VIEs for which Toyota is not the
primary benefi ciary. However, neither the
aggregate size of these joint ventures nor Toyotas
involvements in these entities are material to
Toyotas consolidated fi nancial statements.
Equity in earnings of affi liated companies in
the accompanying consolidated statements
of income. Toyota evaluated its investments in
affi liated companies, considering the length of
time and the extent to which the quoted market
prices have been less than the carrying amounts,
the fi nancial condition and near-term prospects
of the affi liated companies and Toyotas ability
and intent to retain those investments in the
companies for a period of time.
Financial Section
Financial Section
Investor Information
Corporate Information
Special Feature
Consolidated
Performance Highlights
Business Overview
Top Messages
Notes to Consolidated Financial Statements
Affi liated companies and variable interest entities:
12