Toyota 2010 Annual Report Download - page 95
Download and view the complete annual report
Please find page 95 of the 2010 Toyota annual report below. You can navigate through the pages in the report by either clicking on the pages listed below, or by using the keyword search tool below to find specific information within the annual report.-
 1
1 -
2
-
3
-
4
-
5
-
6
-
7
-
8
-
9
-
10
-
11
-
12
-
13
-
14
-
15
-
16
-
17
-
18
-
19
-
20
-
21
-
22
-
23
-
24
-
25
-
26
-
27
-
28
-
29
-
30
-
31
-
32
-
33
-
34
-
35
-
36
-
37
-
38
-
39
-
40
-
41
-
42
-
43
-
44
-
45
-
46
-
47
-
48
-
49
-
50
-
51
-
52
-
53
-
54
-
55
-
56
-
57
-
58
-
59
-
60
-
61
-
62
-
63
-
64
-
65
-
66
-
67
-
68
-
69
-
70
-
71
-
72
-
73
-
74
-
75
-
76
-
77
-
78
-
79
-
80
-
81
-
82
-
83
-
84
-
 85
85 -
 86
86 -
 87
87 -
 88
88 -
 89
89 -
 90
90 -
 91
91 -
 92
92 -
 93
93 -
 94
94 -
 95
95 -
 96
96 -
 97
97 -
 98
98 -
 99
99 -
 100
100 -
 101
101 -
 102
102 -
 103
103 -
 104
104 -
 105
105
 |
 |
TOYOTA ANNUAL REPORT 2010 93
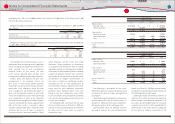
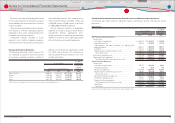
Revenues are attributed to geographies based
on the country location of the parent company
or the subsidiary that transacted the sale with the
external customer.
There are no any individually material countries
with respect to revenues, operating expenses,
operating income, assets and long-lived assets
included in other foreign countries.
Unallocated amounts included in assets
represent assets held for corporate purposes,
which mainly consist of cash and cash equivalents
and marketable securities. Such corporate assets
were ¥4,352,498 million, ¥3,225,901 million and
¥4,205,402 million ($45,200 million), as of March
31, 2008, 2009 and 2010, respectively.
Transfers between industries or geographic
segments are made at amounts which Toyotas
management believes approximate arms-
length transactions. In measuring the reportable
segments income or losses, operating income
consists of revenue less operating expenses.
Yen in millions
U.S. dollars
in millions
For the years ended March 31,
For the year
ended
March 31,
2008 2009 2010 2010
North America ·············································································· ¥9,606,481 ¥6,294,230 ¥5,718,381 $61,462
Europe ······························································································· 3,746,362 2,861,351 2,023,280 21,746
Asia ······································································································ 2,968,460 2,530,352 2,641,471 28,391
Other ·································································································· 3,831,739 3,421,881 2,838,671 30,510
Other consists of Central and South America, Oceania, Africa and the Middle East, etc.
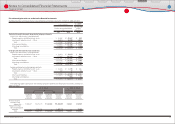
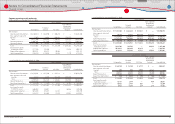
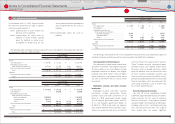
Overseas Revenues by destination
The following information shows revenues that
are attributed to countries based on location
of customers, excluding customers in Japan. In
addition to the disclosure requirements under
U.S. GAAP, Toyota discloses this information in
order to provide fi nancial statement users with
valuable information.
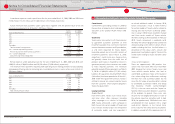
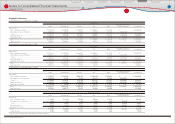
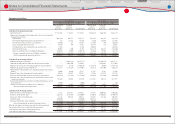
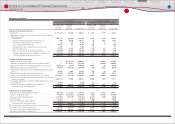
Certain fi nancial statement data on non-fi nancial services and fi nancial services businesses
The fi nancial data below presents separately Toyotas non-fi nancial services and fi nancial services
businesses.
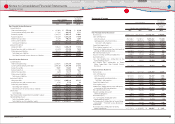
Balance sheets
Yen in millions
U.S. dollars
in millions
March 31, March 31,
2009 2010 2010
Non-Financial Services Businesses
Current assets
Cash and cash equivalents ·········································································· ¥ 1,648,143 ¥ 1,338,821 $ 14,390
Marketable securities ····················································································· 494,476 1,783,629 19,170
Trade accounts and notes receivable, less allowance for
doubtful accounts ··························································································· 1,404,292 1,908,884 20,517
Inventories ··········································································································· 1,459,394 1,422,373 15,288
Prepaid expenses and other current assets ······································· 1,534,119 1,793,622 19,278
Total current assets ····················································································· 6,540,424 8,247,329 88,643
Investments and other assets ········································································ 4,254,126 4,549,658 48,900
Property, plant and equipment ···································································· 5,504,559 4,996,321 53,701
Total Non-Financial Services Businesses assets ··························· 16,299,109 17,793,308 191,244
Financial Services Businesses
Current assets
Cash and cash equivalents ·········································································· 796,137 526,925 5,663
Marketable securities ····················································································· 850 9,536 103
Finance receivables, net ··············································································· 3,891,406 4,209,496 45,244
Prepaid expenses and other current assets ······································· 790,901 653,798 7,027
Total current assets ····················································································· 5,479,294 5,399,755 58,037
Noncurrent fi nance receivables, net ······················································ 5,655,545 5,630,680 60,519
Investments and other assets ···································································· 599,701 529,938 5,696
Property, plant and equipment ································································ 1,897,122 1,714,580 18,428
Total Financial Services Businesses assets ······································ 13,631,662 13,274,953 142,680
Eliminations ········································································································· (868,734) (718,974) (7,728)
Total assets ······································································································· ¥ 29,062,037 ¥ 30,349,287 $ 326,196
Assets in the non-fi nancial services include unallocated corporate assets.
Financial Section
Financial Section
Investor Information
Corporate Information
Special Feature
Consolidated
Performance Highlights
Business Overview
Top Messages
Notes to Consolidated Financial Statements