Toyota 2010 Annual Report Download - page 85
Download and view the complete annual report
Please find page 85 of the 2010 Toyota annual report below. You can navigate through the pages in the report by either clicking on the pages listed below, or by using the keyword search tool below to find specific information within the annual report.-
 1
1 -
2
-
3
-
4
-
5
-
6
-
7
-
8
-
9
-
10
-
11
-
12
-
13
-
14
-
15
-
16
-
17
-
18
-
19
-
20
-
21
-
22
-
23
-
24
-
25
-
26
-
27
-
28
-
29
-
30
-
31
-
32
-
33
-
34
-
35
-
36
-
37
-
38
-
39
-
40
-
41
-
42
-
43
-
44
-
45
-
46
-
47
-
48
-
49
-
50
-
51
-
52
-
53
-
54
-
55
-
56
-
57
-
58
-
59
-
60
-
61
-
62
-
63
-
64
-
65
-
66
-
67
-
68
-
69
-
70
-
71
-
72
-
73
-
74
-
 75
75 -
 76
76 -
 77
77 -
 78
78 -
 79
79 -
 80
80 -
 81
81 -
 82
82 -
 83
83 -
 84
84 -
 85
85 -
 86
86 -
 87
87 -
 88
88 -
 89
89 -
 90
90 -
 91
91 -
 92
92 -
 93
93 -
 94
94 -
 95
95 -
96
-
97
-
98
-
99
-
100
-
101
-
102
-
103
-
104
-
105
 |
 |
TOYOTA ANNUAL REPORT 2010 83
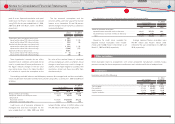
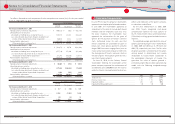
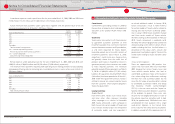
Weighted-average assumptions used to determine benefi t obligations as of March 31, 2009 and 2010
are as follows:
March 31,
2009 2010
Discount rate ········································································································································· 2.8% 2.8%
Rate of compensation increase ··································································································· 0.1 ‒ 10.0% 0.5 ‒ 10.0%
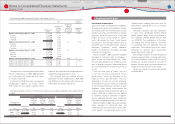
The expected rate of return on plan assets is
determined after considering several applicable
factors including, the composition of plan assets
held, assumed risks of asset management,
historical results of the returns on plan
assets, Toyotas principal policy for plan asset
management, and forecasted market conditions.
Toyotas policy and objective for plan asset
management is to maximize returns on
plan assets to meet future benefi t payment
requirements under risks which Toyota considers
permissible. Asset allocations under the plan
asset management are determined based on
plan asset management policies of each plan
which are established to achieve the optimized
asset compositions in terms of the long-term
overall plan asset management. Excepting equity
securities contributed by Toyota, approximately
50% of the plan assets is invested in equity
securities, approximately 30% is invested in debt
securities, and the rest of them is invested in
insurance contracts and other products. When
actual allocations are not in line with target
allocations, Toyota rebalances its investments
in accordance with the policies. Prior to making
individual investments, Toyota performs in-depth
assessments of corresponding factors including
category of products, industry type, currencies
and liquidity of each potential investment under
consideration to mitigate concentrations of
risks such as market risk and foreign currency
exchange rate risk. To assess performance of
the investments, Toyota establishes bench mark
return rates for each individual investment,
combines these individual bench mark rates
based on the asset composition ratios within
each asset category, and compares the combined
rates with the corresponding actual return rates
on each asset category.
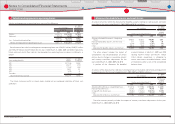
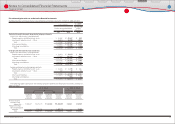
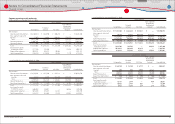
The following table summarizes the fair value
of classes of plan assets as of March 31, 2010. See
note 26 to the consolidated fi nancial statements
for three levels of input which are used to
measure fair value.
Weighted-average assumptions used to determine net periodic pension cost for the years ended March
31, 2008, 2009 and 2010 are as follows:
For the years ended March 31,
2008 2009 2010
Discount rate ································································································ 2.7% 2.8% 2.8%
Expected return on plan assets ·························································· 3.4% 3.6% 3.6%
Rate of compensation increase ·························································· 0.1 ‒ 10.0% 0.1 ‒ 10.0% 0.1 ‒ 10.0%
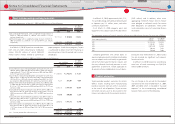
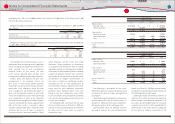
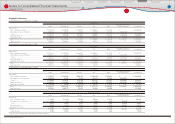
The following is description of the assets,
information about the valuation techniques used
to measure fair value, key inputs and signifi cant
assumptions:
Quoted market prices for identical securities are
used to measure fair value of common stocks. As
of March 31, 2010, common stocks include 64%
of Japanese stocks and 36% of foreign stocks.
Quoted market prices for identical securities
are used to measure fair value of government
bonds. As of March 31, 2010, government bonds
include 25% of Japanese government bonds and
75% of foreign government bonds.
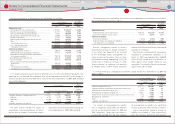
Commingled funds are benefi cial interests of
collective trust, which are mainly invested by the
parent company and Japanese subsidiaries. The
fair values of commingled funds are measured
using the net asset value (NAV) provided by the
administrator of the fund, and are categorized
by the ability to redeem investments at the
Yen in millions
March 31, 2010
Level 1 Level 2 Level 3 Total
Equity securities
Common stocks ········································································ ¥ 471,262 ¥ ̶ ¥ ̶ ¥ 471,262
Commingled funds ································································· ̶ 237,495 ̶ 237,495
471,262 237,495 ̶ 708,757
Debt securities
Government bonds ································································· 79,739 ̶ ̶ 79,739
Commingled funds ································································· ̶ 147,345 2,663 150,008
Other ······························································································· 39,231 19,561 928 59,720
118,970 166,906 3,591 289,467
Insurance contracts ····································································· ̶ 97,086 ̶ 97,086
Other ··································································································· 35,774 1,449 46,518 83,741
Total ································································································· ¥ 626,006 ¥ 502,936 ¥ 50,109 ¥ 1,179,051
U.S. dollars in millions
March 31, 2010
Level 1 Level 2 Level 3 Total
Equity securities ···········································································
Common stocks ······································································· $ 5,065 $ ̶ $ ̶ $ 5,065
Commingled funds ································································ ̶ 2,553 ̶ 2,553
5,065 2,553 ̶ 7,618
Debt securities
Government bonds ································································ 857 ̶ ̶ 857
Commingled funds ································································ ̶ 1,584 28 1,612
Other ······························································································ 422 210 10 642
1,279 1,794 38 3,111
Insurance contracts ···································································· ̶ 1,043 ̶ 1,043
Other ·································································································· 384 16 500 900
Total ································································································ $ 6,728 $ 5,406 $ 538 $ 12,672
ending March 31, 2011 are ¥(15,000) million ($(161) million), ¥15,700 million ($169 million) and ¥1,900
million ($20 million), respectively.
Financial Section
Financial Section
Investor Information
Corporate Information
Special Feature
Consolidated
Performance Highlights
Business Overview
Top Messages
Notes to Consolidated Financial Statements