Toyota 2010 Annual Report Download - page 89
Download and view the complete annual report
Please find page 89 of the 2010 Toyota annual report below. You can navigate through the pages in the report by either clicking on the pages listed below, or by using the keyword search tool below to find specific information within the annual report.-
 1
1 -
2
-
3
-
4
-
5
-
6
-
7
-
8
-
9
-
10
-
11
-
12
-
13
-
14
-
15
-
16
-
17
-
18
-
19
-
20
-
21
-
22
-
23
-
24
-
25
-
26
-
27
-
28
-
29
-
30
-
31
-
32
-
33
-
34
-
35
-
36
-
37
-
38
-
39
-
40
-
41
-
42
-
43
-
44
-
45
-
46
-
47
-
48
-
49
-
50
-
51
-
52
-
53
-
54
-
55
-
56
-
57
-
58
-
59
-
60
-
61
-
62
-
63
-
64
-
65
-
66
-
67
-
68
-
69
-
70
-
71
-
72
-
73
-
74
-
75
-
76
-
77
-
78
-
 79
79 -
 80
80 -
 81
81 -
 82
82 -
 83
83 -
 84
84 -
 85
85 -
 86
86 -
 87
87 -
 88
88 -
 89
89 -
 90
90 -
 91
91 -
 92
92 -
 93
93 -
 94
94 -
 95
95 -
 96
96 -
 97
97 -
 98
98 -
 99
99 -
100
-
101
-
102
-
103
-
104
-
105
 |
 |
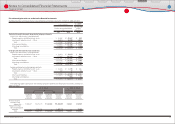
TOYOTA ANNUAL REPORT 2010 87
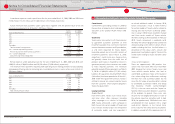
Toyota has certain fi nancial instruments,
including fi nancial assets and liabilities and off -
balance sheet fi nancial instruments which arose
in the normal course of business. These fi nancial
instruments are executed with creditworthy
fi nancial institutions, and virtually all foreign
currency contracts are denominated in U.S.
dollars, euros and other currencies of major
industrialized countries. Financial instruments
involve, to varying degrees, market risk as
instruments are subject to price fl uctuations,
and elements of credit risk in the event a
counterparty should default. In the unlikely
event the counterparties fail to meet the
contractual terms of a foreign currency or an
interest rate instrument, Toyotas risk is limited
to the fair value of the instrument. Although
Toyota may be exposed to losses in the event of
non-performance by counterparties on fi nancial
instruments, it does not anticipate signifi cant
losses due to the nature of its counterparties.
Counterparties to Toyotas fi nancial instruments
represent, in general, international fi nancial
institutions. Additionally, Toyota does not
have a signifi cant exposure to any individual
counterparty. Toyota believes that the overall
credit risk related to its fi nancial instruments is
not signifi cant.
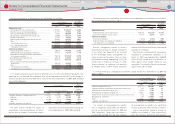
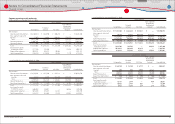
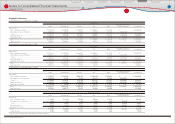
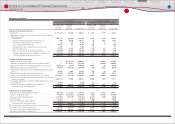
The estimated fair values of Toyotas fi nancial instruments, excluding marketable securities and other
securities investments and affi liated companies and derivative fi nancial instruments, are summarized as
follows:
Yen in millions
March 31, 2009
Carrying
amount
Estimated
fair value
Asset (Liability)
Cash and cash equivalents ·················································· ¥ 2,444,280 ¥ 2,444,280
Time deposits ············································································· 45,178 45,178
Total fi nance receivables, net ············································ 8,450,709 8,677,228
Other receivables ····································································· 332,722 332,722
Short-term borrowings ························································· (3,617,672) (3,617,672)
Long-term debt including the current portion ······· (8,949,615) (9,026,007)
Yen in millions U.S. dollars in millions
March 31, 2010 March 31, 2010
Carrying
amount
Estimated
fair value
Carrying
amount
Estimated
fair value
Asset (Liability)
Cash and cash equivalents ················································· ¥ 1,865,746 ¥ 1,865,746 $ 20,053 $ 20,053
Time deposits ············································································ 392,724 392,724 4,221 4,221
Total fi nance receivables, net ··········································· 8,759,826 9,112,527 94,151 97,942
Other receivables ···································································· 360,379 360,379 3,873 3,873
Short-term borrowings ························································ (3,279,673) (3,279,673) (35,250) (35,250)
Long-term debt including the current portion ······ (9,191,490) (9,297,904) (98,791) (99,934)
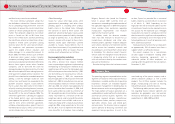
Cash and cash equivalents, time deposits and
other receivables
In the normal course of business, substantially
all cash and cash equivalents, time deposits and
other receivables are highly liquid and are carried
at amounts which approximate fair value.
Finance receivables, net
The carrying value of variable rate fi nance
receivables was assumed to approximate
fair value as they were repriced at prevailing
market rates. The fair value of fi xed rate fi nance
receivables was estimated by discounting
expected cash fl ows to present value using the
rates at which new loans of similar credit quality
and maturity would be made.
Short-term borrowings and long-term debt
The fair values of short-term borrowings and
total long-term debt including the current
portion were estimated based on the discounted
amounts of future cash fl ows using Toyotas
current incremental borrowing rates for similar
liabilities.
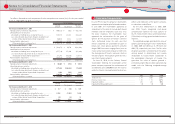
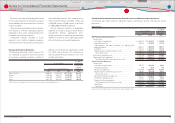
Toyota leases certain assets under capital lease and operating lease arrangements.
An analysis of leased assets under capital leases is as follows:
Yen in millions
U.S. dollars
in millions
March 31, March 31,
2009 2010 2010
Class of property
Building ····························································································································· ¥ 24,369 ¥ 23,518 $ 253
Machinery and equipment ····················································································· 51,971 48,043 516
Less - Accumulated depreciation ······································································· (33,845) (36,926) (397)
¥ 42,495 ¥ 34,635 $ 372
Financial Section
Financial Section
Investor Information
Corporate Information
Special Feature
Consolidated
Performance Highlights
Business Overview
Top Messages
Notes to Consolidated Financial Statements
Other fi nancial instruments:
21
Lease commitments:
22