Toyota 2010 Annual Report Download - page 82
Download and view the complete annual report
Please find page 82 of the 2010 Toyota annual report below. You can navigate through the pages in the report by either clicking on the pages listed below, or by using the keyword search tool below to find specific information within the annual report.-
 1
1 -
2
-
3
-
4
-
5
-
6
-
7
-
8
-
9
-
10
-
11
-
12
-
13
-
14
-
15
-
16
-
17
-
18
-
19
-
20
-
21
-
22
-
23
-
24
-
25
-
26
-
27
-
28
-
29
-
30
-
31
-
32
-
33
-
34
-
35
-
36
-
37
-
38
-
39
-
40
-
41
-
42
-
43
-
44
-
45
-
46
-
47
-
48
-
49
-
50
-
51
-
52
-
53
-
54
-
55
-
56
-
57
-
58
-
59
-
60
-
61
-
62
-
63
-
64
-
65
-
66
-
67
-
68
-
69
-
70
-
71
-
 72
72 -
 73
73 -
 74
74 -
 75
75 -
 76
76 -
 77
77 -
 78
78 -
 79
79 -
 80
80 -
 81
81 -
 82
82 -
 83
83 -
 84
84 -
 85
85 -
 86
86 -
 87
87 -
 88
88 -
 89
89 -
 90
90 -
 91
91 -
 92
92 -
93
-
94
-
95
-
96
-
97
-
98
-
99
-
100
-
101
-
102
-
103
-
104
-
105
 |
 |

TOYOTA ANNUAL REPORT 2010 80
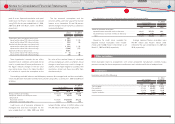
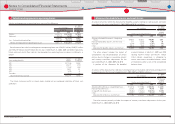
Tax eff ects allocated to each component of other comprehensive income (loss) for the years ended
March 31, 2008, 2009 and 2010 are as follows:
Yen in millions
Pre-tax
amount Tax amount
Net-of-tax
amount
For the year ended March 31, 2008
Foreign currency translation adjustments ················································ ¥ (460,723) ¥ (466) ¥ (461,189)
Unrealized losses on securities:
Unrealized net holding losses arising for the year ···························· (545,555) 219,313 (326,242)
Less: reclassifi cation adjustments for gains included in net
income attributable to Toyota Motor Corporation ······················· (36,099) 14,512 (21,587)
Pension liability adjustments ············································································ (221,142) 87,565 (133,577)
Other comprehensive income (loss)····················································· ¥ (1,263,519) ¥ 320,924 ¥ (942,595)
For the year ended March 31, 2009
Foreign currency translation adjustments ··············································· ¥ (391,873) ¥ 10,570 ¥ (381,303)
Unrealized losses on securities:
Unrealized net holding losses arising for the year ···························· (677,710) 255,890 (421,820)
Less: reclassifi cation adjustments for losses included in net loss
attributable to Toyota Motor Corporation ········································ 215,249 (86,530) 128,719
Pension liability adjustments ············································································ (319,613) 127,441 (192,172)
Other comprehensive income (loss)····················································· ¥ (1,173,947) ¥ 307,371 ¥ (866,576)
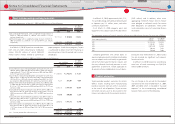
For the year ended March 31, 2010
Foreign currency translation adjustments ················································ ¥ 10,809 ¥ (915) ¥ 9,894
Unrealized gains on securities:
Unrealized net holding gains arising for the year ······························ 277,838 (102,538) 175,300
Less: reclassifi cation adjustments for gains included in net
income attributable to Toyota Motor Corporation ······················· 1,852 (745) 1,107
Pension liability adjustments ············································································ 124,526 (49,881) 74,645
Other comprehensive income ································································· ¥ 415,025 ¥ (154,079) ¥ 260,946
U.S. dollars in millions
Pre-tax
amount Tax amount
Net-of-tax
amount
For the year ended March 31, 2010
Foreign currency translation adjustments ················································· $ 117 $ (10) $ 107
Unrealized gains on securities:
Unrealized net holding gains arising for the year ······························· 2,986 (1,102) 1,884
Less: reclassifi cation adjustments for gains included in net
income attributable to Toyota Motor Corporation ························ 20 (8) 12
Pension liability adjustments ············································································· 1,338 (536) 802
Other comprehensive income ·································································· $ 4,461 $ (1,656) $ 2,805
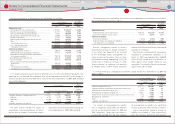
In June 1997, the parent companys shareholders
approved a stock option plan for board members.
In June 2001, the shareholders approved an
amendment of the plan to include both board
members and key employees. Each year, since
the plans inception, the shareholders have
approved the authorization for the grant of
options for the purchase of Toyotas common
stock. Authorized shares for each year that
remain ungranted are unavailable for grant in
future years. Stock options granted in and after
August 2002 have terms ranging from 6 years to
8 years and an exercise price equal to 1.025 times
the closing price of Toyotas common stock on
the date of grant. These options generally vest 2
years from the date of grant.
On June 24, 2010, at the Ordinary General
Shareholders Meeting, the shareholders of the
parent company approved the authorization of
an additional up to 3,600,000 shares for issuance
under the Toyotas stock option plan for directors,
offi cers and employees of the parent company,
its subsidiaries and affi liates.
For the years ended March 31, 2008, 2009
and 2010, Toyota recognized stock-based
compensation expenses for stock options of
¥3,273 million, ¥3,015 million and ¥2,446 million
($26 million) as selling, general and administrative
expenses.
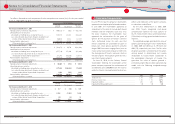
The weighted-average grant-date fair value of
options granted during the years ended March
31, 2008, 2009 and 2010 was ¥1,199, ¥635 and
¥803 ($9), respectively per share. The fair value
of options granted is amortized over the option
vesting period in determining net income
attributable to Toyota Motor Corporation in
the consolidated statements of income. The
grant-date fair value of options granted is
estimated using the Black-Scholes option pricing
model with the following weighted-average
assumptions:
2008 2009 2010
Dividend rate ···················································································································· 1.7% 3.0% 2.4%
Risk-free interest rate···································································································· 1.3% 1.1% 0.7%
Expected volatility ········································································································· 23% 23% 30%
Expected holding period (years) ············································································ 5.0 5.0 5.0
Financial Section
Financial Section
Investor Information
Corporate Information
Special Feature
Consolidated
Performance Highlights
Business Overview
Top Messages
Notes to Consolidated Financial Statements
Stock-based compensation:
18