Toyota 2010 Annual Report Download - page 96
Download and view the complete annual report
Please find page 96 of the 2010 Toyota annual report below. You can navigate through the pages in the report by either clicking on the pages listed below, or by using the keyword search tool below to find specific information within the annual report.-
 1
1 -
2
-
3
-
4
-
5
-
6
-
7
-
8
-
9
-
10
-
11
-
12
-
13
-
14
-
15
-
16
-
17
-
18
-
19
-
20
-
21
-
22
-
23
-
24
-
25
-
26
-
27
-
28
-
29
-
30
-
31
-
32
-
33
-
34
-
35
-
36
-
37
-
38
-
39
-
40
-
41
-
42
-
43
-
44
-
45
-
46
-
47
-
48
-
49
-
50
-
51
-
52
-
53
-
54
-
55
-
56
-
57
-
58
-
59
-
60
-
61
-
62
-
63
-
64
-
65
-
66
-
67
-
68
-
69
-
70
-
71
-
72
-
73
-
74
-
75
-
76
-
77
-
78
-
79
-
80
-
81
-
82
-
83
-
84
-
85
-
 86
86 -
 87
87 -
 88
88 -
 89
89 -
 90
90 -
 91
91 -
 92
92 -
 93
93 -
 94
94 -
 95
95 -
 96
96 -
 97
97 -
 98
98 -
 99
99 -
 100
100 -
 101
101 -
 102
102 -
 103
103 -
 104
104 -
 105
105
 |
 |

TOYOTA ANNUAL REPORT 2010 94
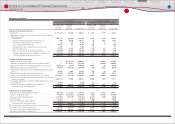
Yen in millions
U.S. dollars
in millions
March 31, March 31,
2009 2010 2010
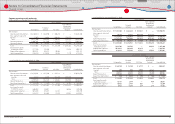
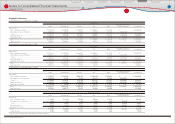
Non-Financial Services Businesses
Current liabilities
Short-term borrowings ················································································· ¥ 825,029 ¥ 575,890 $ 6,190
Current portion of long-term debt ························································· 115,942 289,447 3,111
Accounts payable ···························································································· 1,299,523 1,954,147 21,003
Accrued expenses ···························································································· 1,432,988 1,627,228 17,490
Income taxes payable ···················································································· 47,648 140,210 1,507
Other current liabilities ·················································································· 944,303 931,727 10,014
Total current liabilities ··············································································· 4,665,433 5,518,649 59,315
Long-term liabilities
Long-term debt ································································································· 850,233 1,095,270 11,772
Accrued pension and severance costs ················································· 629,870 672,905 7,232
Other long-term liabilities ··········································································· 444,529 604,903 6,502
Total long-term liabilities ········································································· 1,924,632 2,373,078 25,506
Total Non-Financial Services Businesses liabilities ····················· 6,590,065 7,891,727 84,821
Financial Services Businesses
Current liabilities
Short-term borrowings ················································································· 3,370,981 3,118,938 33,523
Current portion of long-term debt ························································· 2,640,104 1,968,908 21,162
Accounts payable ···························································································· 10,001 13,063 140
Accrued expenses ···························································································· 111,766 113,559 1,221
Income taxes payable ···················································································· 3,650 13,177 141
Other current liabilities ·················································································· 515,166 519,011 5,578
Total current liabilities ··············································································· 6,651,668 5,746,656 61,765
Long-term liabilities
Long-term debt ································································································· 5,592,641 6,060,349 65,137
Accrued pension and severance costs ················································· 4,742 5,772 62
Other long-term liabilities ··········································································· 491,397 433,641 4,661
Total long-term liabilities ········································································· 6,088,780 6,499,762 69,860
Total Financial Services Businesses liabilities································· 12,740,448 12,246,418 131,625
Eliminations ············································································································· (869,213) (719,301) (7,731)
Total liabilities ································································································· 18,461,300 19,418,844 208,715
Total Toyota Motor Corporation shareholders equity ····················· 10,061,207 10,359,723 111,347
Noncontrolling interest ···················································································· 539,530 570,720 6,134
Total shareholders equity ······································································· 10,600,737 10,930,443 117,481
Total liabilities and shareholders equity·········································· ¥ 29,062,037 ¥ 30,349,287 $ 326,196
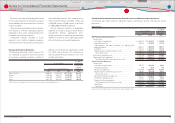
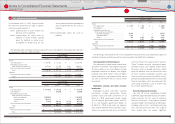
Statements of income
Yen in millions
U.S. dollars
in millions
For the years ended March 31,
For the year
ended
March 31,
2008 2009 2010 2010
Non-Financial Services Businesses
Net revenues ········································································ ¥ 24,831,172 ¥ 19,182,161 ¥ 17,732,143 $ 190,586
Costs and expenses
Cost of revenues ····························································· 20,459,061 17,470,791 15,973,442 171,684
Selling, general and administrative ······················ 2,181,491 2,097,674 1,854,710 19,934
Total costs and expenses ······································· 22,640,552 19,568,465 17,828,152 191,618
Operating income (loss) ················································· 2,190,620 (386,304) (96,009) (1,032)
Other income (expense), net ······································· 176,417 (71,925) 144,625 1,554
Income (loss) before income taxes and equity in
earnings of affi liated companies···························· 2,367,037 (458,229) 48,616 522
Provision for income taxes ············································ 889,660 (10,152) 42,342 455
Equity in earnings of affi liated companies ··········· 268,025 53,226 109,944 1,182
Net income (loss)································································ 1,745,402 (394,851) 116,218 1,249
Less: Net (income) loss attributable to the
noncontrolling interest ··············································· (73,543) 26,282 (32,103) (345)
Net income (loss) attributable to Toyota
Motor Corporation‒ Non‒Financial Services
Businesses ·········································································· 1,671,859 (368,569) 84,115 904
Financial Services Businesses
Net revenues ········································································ 1,498,354 1,377,548 1,245,407 13,386
Costs and expenses
Cost of revenues ····························································· 1,075,972 994,191 716,997 7,706
Selling, general and administrative ······················ 335,888 455,304 281,483 3,026
Total costs and expenses ······································· 1,411,860 1,449,495 998,480 10,732
Operating income (loss) ················································· 86,494 (71,947) 246,927 2,654
Other expense, net ···························································· (16,265) (30,233) (3,923) (42)
Income (loss) before income taxes and equity
in earnings of affi liated companies ······················ 70,229 (102,180) 243,004 2,612
Provision for income taxes ············································ 21,904 (46,298) 50,362 541
Equity in earnings (losses) of
affi liated companies ····················································· 2,089 (10,502) (64,536) (694)
Net income (loss)································································ 50,414 (66,384) 128,106 1,377
Less: Net income attributable to the
noncontrolling interest ··············································· (4,419) (2,004) (2,653) (29)
Net income (loss) attributable to Toyota Motor
Corporation − Financial Services Businesses · 45,995 (68,388) 125,453 1,348
Eliminations ··········································································· 25 20 (112) (1)
Net income (loss) attributable to Toyota
Motor Corporation ························································ ¥ 1,717,879 ¥ (436,937) ¥ 209,456 $ 2,251
Financial Section
Financial Section
Investor Information
Corporate Information
Special Feature
Consolidated
Performance Highlights
Business Overview
Top Messages
Notes to Consolidated Financial Statements