Tesco 2009 Annual Report Download - page 91
Download and view the complete annual report
Please find page 91 of the 2009 Tesco annual report below. You can navigate through the pages in the report by either clicking on the pages listed below, or by using the keyword search tool below to find specific information within the annual report.-
 1
1 -
2
-
3
-
4
-
5
-
6
-
7
-
8
-
9
-
10
-
11
-
12
-
13
-
14
-
15
-
16
-
17
-
18
-
19
-
20
-
21
-
22
-
23
-
24
-
25
-
26
-
27
-
28
-
29
-
30
-
31
-
32
-
33
-
34
-
35
-
36
-
37
-
38
-
39
-
40
-
41
-
42
-
43
-
44
-
45
-
46
-
47
-
48
-
49
-
50
-
51
-
52
-
53
-
54
-
55
-
56
-
57
-
58
-
59
-
60
-
61
-
62
-
63
-
64
-
65
-
66
-
67
-
68
-
69
-
70
-
71
-
72
-
73
-
74
-
75
-
76
-
77
-
78
-
79
-
80
-
 81
81 -
 82
82 -
 83
83 -
 84
84 -
 85
85 -
 86
86 -
 87
87 -
 88
88 -
 89
89 -
 90
90 -
 91
91 -
 92
92 -
 93
93 -
 94
94 -
 95
95 -
 96
96 -
 97
97 -
 98
98 -
 99
99 -
 100
100 -
 101
101 -
102
-
103
-
104
-
105
-
106
-
107
-
108
-
109
-
110
-
111
-
112
-
113
-
114
-
115
-
116
-
117
-
118
-
119
-
120
-
121
-
122
-
123
-
124
-
125
-
126
-
127
-
128
-
129
-
130
-
131
-
132
-
133
-
134
-
135
-
136
-
137
-
138
-
139
-
140
 |
 |

89
FINANCIAL STATEMENTS
Tesco PLC Annual Report and Financial Statements 2009
To find out more go to
www.tesco.com/annualreport09
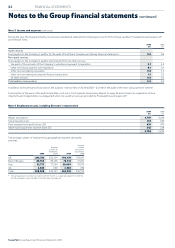
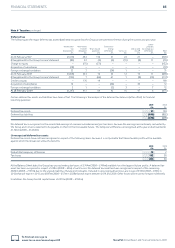
Note 11 Property, plant and equipment
Land and
buildings Other(a) Total
£m £m £m
Cost
At 23 February 2008 19,210 6,340 25,550
Foreign currency translation 434 191 625
Additions(b) 3,345 1,013 4,358
Acquisitions through business combinations 586 34 620
Reclassification across categories (305) 45 (260)
Classified as held for sale (74) (8) (82)
Disposals (847) (120) (967)
At 28 February 2009 22,349 7,495 29,844
Accumulated depreciation and impairment losses
At 23 February 2008 2,280 3,483 5,763
Foreign currency translation 55 103 158
Charge for the year 352 659 1,011
Reclassification across categories (5) – (5)
Classified as held for sale 18 (3) 15
Disposals (128) (90) (218)
Impairment losses 56 – 56
Reversal of impairment losses (88) – (88)
At 28 February 2009 2,540 4,152 6,692
Net carrying value(c)(d)(e)
At 28 February 2009 19,809 3,343 23,152
At 23 February 2008 16,930 2,857 19,787
Capital work in progress included above(f)
At 28 February 2009 1,375 159 1,534
(a) Other assets consist of plant, equipment, fixtures and fittings and motor vehicles.
(b) Includes £152m (2008 – £103m) in respect of interest capitalised, principally relating to land and building assets. The capitalisation rate used to determine the amount of finance costs
capitalised during the year was 5.1% (2008 – 5.1%). Interest capitalised is deducted in determining taxable profit in the year in which it is incurred.
(c) Net carrying value includes:
(i) Capitalised interest at 28 February 2009 of £910m (2008 – £790m).
(ii) Assets held under finance leases which are analysed below:
2009 2008
Land and Land and
buildings Other(a) buildings Other(a)
£m £m £m £m
Cost 121 578 96 723
Accumulated depreciation
and impairment losses (22) (390) (20) (441)
Net carrying value 99 188 76 282
These assets are pledged as security for the finance lease liabilities.
(d) The net carrying value of land and buildings comprises:
2009 2008
£m £m
Freehold 17, 332 15,209
Long leasehold – 50 years or more 1,450 892
Short leasehold – less than 50 years 1,027 829
Net carrying value 19,809 16,930
(e) Carrying value of land and buildings includes £4m (2008 – £6m) relating to the
prepayment of lease premiums.
(f) Capital work in progress does not include land.