Tesco 2009 Annual Report Download - page 70
Download and view the complete annual report
Please find page 70 of the 2009 Tesco annual report below. You can navigate through the pages in the report by either clicking on the pages listed below, or by using the keyword search tool below to find specific information within the annual report.-
 1
1 -
2
-
3
-
4
-
5
-
6
-
7
-
8
-
9
-
10
-
11
-
12
-
13
-
14
-
15
-
16
-
17
-
18
-
19
-
20
-
21
-
22
-
23
-
24
-
25
-
26
-
27
-
28
-
29
-
30
-
31
-
32
-
33
-
34
-
35
-
36
-
37
-
38
-
39
-
40
-
41
-
42
-
43
-
44
-
45
-
46
-
47
-
48
-
49
-
50
-
51
-
52
-
53
-
54
-
55
-
56
-
57
-
58
-
59
-
 60
60 -
 61
61 -
 62
62 -
 63
63 -
 64
64 -
 65
65 -
 66
66 -
 67
67 -
 68
68 -
 69
69 -
 70
70 -
 71
71 -
 72
72 -
 73
73 -
 74
74 -
 75
75 -
 76
76 -
 77
77 -
 78
78 -
 79
79 -
 80
80 -
81
-
82
-
83
-
84
-
85
-
86
-
87
-
88
-
89
-
90
-
91
-
92
-
93
-
94
-
95
-
96
-
97
-
98
-
99
-
100
-
101
-
102
-
103
-
104
-
105
-
106
-
107
-
108
-
109
-
110
-
111
-
112
-
113
-
114
-
115
-
116
-
117
-
118
-
119
-
120
-
121
-
122
-
123
-
124
-
125
-
126
-
127
-
128
-
129
-
130
-
131
-
132
-
133
-
134
-
135
-
136
-
137
-
138
-
139
-
140
 |
 |

68 FINANCIAL STATEMENTS
Tesco PLC Annual Report and Financial Statements 2009
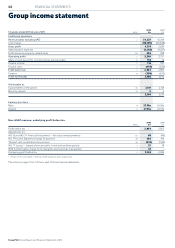
Group income statement
2009 2008*
53 weeks ended 28 February 2009 notes £m £m
Continuing operations
Revenue (sales excluding VAT) 2 54,327 47,298
Cost of sales (50,109) (43,668)
Gross profit 4,218 3,630
Administrative expenses (1,248) (1,027)
Profit arising on property-related items 2/3 236 188
Operating profit 2 3,206 2,791
Share of post-tax profits of joint ventures and associates 13 110 75
Finance income 5 116 187
Finance costs 5 (478) (250)
Profit before tax 3 2,954 2,803
Taxation 6 (788) (673)
Profit for the year 2,166 2,130
Attributable to:
Equity holders of the parent 30 2,161 2,124
Minority interests 30 5 6
2,166 2,130
Earnings per share
Basic 9 27.50p 26.95p
Diluted 9 27.31p 26.61p
Non-GAAP measure: underlying profit before tax
2009 2008*
notes £m £m
Profit before tax 2,954 2,803
Adjustments for:
IAS 32 and IAS 39 ‘Financial Instruments’ – Fair value remeasurements 1/5 88 (49)
IAS 19 Income Statement charge for pensions 28 403 414
‘Normal’ cash contributions for pensions 28 (376) (340)
IAS 17 ‘Leases’ – impact of annual uplifts in rent and rent-free periods 1 27 18
IFRS 3 Amortisation charge from intangible assets arising on acquisition 1 32 –
Underlying profit before tax 1 3,128 2,846
* Results for the year ended 23 February 2008 include 52 weeks of operation.
The notes on pages 72 to 123 form part of these financial statements.