Tesco 2009 Annual Report Download - page 82
Download and view the complete annual report
Please find page 82 of the 2009 Tesco annual report below. You can navigate through the pages in the report by either clicking on the pages listed below, or by using the keyword search tool below to find specific information within the annual report.-
 1
1 -
2
-
3
-
4
-
5
-
6
-
7
-
8
-
9
-
10
-
11
-
12
-
13
-
14
-
15
-
16
-
17
-
18
-
19
-
20
-
21
-
22
-
23
-
24
-
25
-
26
-
27
-
28
-
29
-
30
-
31
-
32
-
33
-
34
-
35
-
36
-
37
-
38
-
39
-
40
-
41
-
42
-
43
-
44
-
45
-
46
-
47
-
48
-
49
-
50
-
51
-
52
-
53
-
54
-
55
-
56
-
57
-
58
-
59
-
60
-
61
-
62
-
63
-
64
-
65
-
66
-
67
-
68
-
69
-
70
-
71
-
 72
72 -
 73
73 -
 74
74 -
 75
75 -
 76
76 -
 77
77 -
 78
78 -
 79
79 -
 80
80 -
 81
81 -
 82
82 -
 83
83 -
 84
84 -
 85
85 -
 86
86 -
 87
87 -
 88
88 -
 89
89 -
 90
90 -
 91
91 -
 92
92 -
93
-
94
-
95
-
96
-
97
-
98
-
99
-
100
-
101
-
102
-
103
-
104
-
105
-
106
-
107
-
108
-
109
-
110
-
111
-
112
-
113
-
114
-
115
-
116
-
117
-
118
-
119
-
120
-
121
-
122
-
123
-
124
-
125
-
126
-
127
-
128
-
129
-
130
-
131
-
132
-
133
-
134
-
135
-
136
-
137
-
138
-
139
-
140
 |
 |

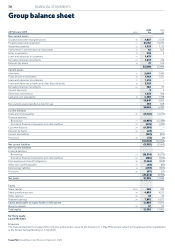
80 FINANCIAL STATEMENTS
Tesco PLC Annual Report and Financial Statements 2009
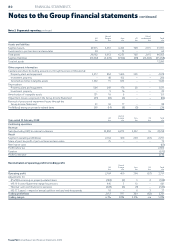
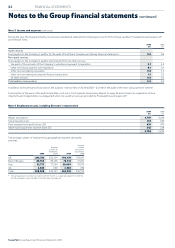
Note 2 Segmental reporting continued
Rest of Other/
UK Europe Asia US unallocated Total
£m £m £m £m £m £m
Assets and liabilities
Segment assets 29,913 6,953 6,242 768 2,115 45,991
Investments in joint ventures and associates 49 – 13 – – 62
Total assets 29,962 6,953 6,255 768 2,115 46,053
Segment liabilities (13,032) (1,270) (1,966) (98) (16,692) (33,058)
Total net assets 12,995
Other segment information
Capital expenditure (including acquisitions through business combinations):
Property, plant and equipment 2,417 852 1,404 305 – 4,978
Investment property – 48 152 – – 200
Goodwill and other intangible assets 1,242 15 385 – – 1,642
Depreciation:
Property, plant and equipment 566 249 176 20 – 1,011
Investment property – 9 16 – – 25
Amortisation of intangible assets 131 16 6 – – 153
Impairment losses recognised in the Group Income Statement (21) (41) (4) – – (66)
Reversal of prior period impairment losses through the
Group Income Statement 21 50 17 – – 88
Profit/(loss) arising on property-related items 263 (14) (8) (5) – 236
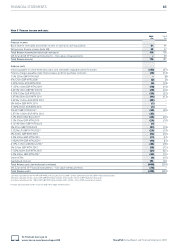
Rest of
UK Europe Asia US Total
Year ended 23 February 2008 £m £m £m £m £m
Continuing operations
Revenue
Sales (excluding VAT) to external customers 34,858 6,872 5,552 16 47,298
Result
Segment operating profit/(loss) 2,164 400 294 (67) 2,791
Share of post-tax profit of joint ventures and associates 75 – – – 75
Net finance costs (63)
Profit before tax 2,803
Taxation (673)
Profit for the year 2,130
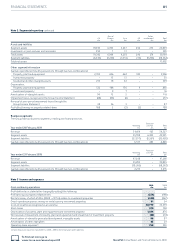
Reconciliation of operating profit to trading profit
Rest of
UK Europe Asia US Total
£m £m £m £m £m
Operating profit 2,164 400 294 (67) 2,791
Adjustments for:
(Profit)/loss arising on property-related items (188) (5) 3 2 (188)
IAS 19 Income Statement charge for pensions 446 5 10 – 461
‘Normal’ cash contributions for pensions (328) (3) (9) – (340)
IAS 17 ‘Leases’ – impact of annual uplifts in rent and rent-free periods 18 – 6 3 27
Trading profit/(loss) 2,112 397 304 (62) 2,751
Trading margin 6.1% 5.8% 5.5% n/a 5.8%
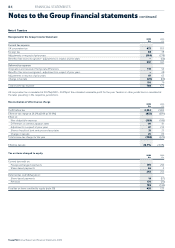
Notes to the Group financial statements continued