Tesco 2009 Annual Report Download - page 131
Download and view the complete annual report
Please find page 131 of the 2009 Tesco annual report below. You can navigate through the pages in the report by either clicking on the pages listed below, or by using the keyword search tool below to find specific information within the annual report.-
 1
1 -
2
-
3
-
4
-
5
-
6
-
7
-
8
-
9
-
10
-
11
-
12
-
13
-
14
-
15
-
16
-
17
-
18
-
19
-
20
-
21
-
22
-
23
-
24
-
25
-
26
-
27
-
28
-
29
-
30
-
31
-
32
-
33
-
34
-
35
-
36
-
37
-
38
-
39
-
40
-
41
-
42
-
43
-
44
-
45
-
46
-
47
-
48
-
49
-
50
-
51
-
52
-
53
-
54
-
55
-
56
-
57
-
58
-
59
-
60
-
61
-
62
-
63
-
64
-
65
-
66
-
67
-
68
-
69
-
70
-
71
-
72
-
73
-
74
-
75
-
76
-
77
-
78
-
79
-
80
-
81
-
82
-
83
-
84
-
85
-
86
-
87
-
88
-
89
-
90
-
91
-
92
-
93
-
94
-
95
-
96
-
97
-
98
-
99
-
100
-
101
-
102
-
103
-
104
-
105
-
106
-
107
-
108
-
109
-
110
-
111
-
112
-
113
-
114
-
115
-
116
-
117
-
118
-
119
-
120
-
 121
121 -
 122
122 -
 123
123 -
 124
124 -
 125
125 -
 126
126 -
 127
127 -
 128
128 -
 129
129 -
 130
130 -
 131
131 -
 132
132 -
 133
133 -
 134
134 -
 135
135 -
 136
136 -
 137
137 -
 138
138 -
 139
139 -
 140
140
 |
 |

129
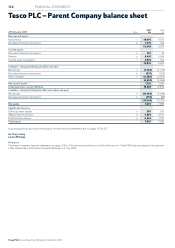
FINANCIAL STATEMENTS
Tesco PLC Annual Report and Financial Statements 2009
To find out more go to
www.tesco.com/annualreport09
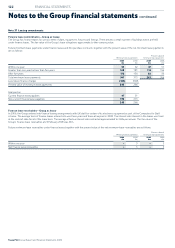
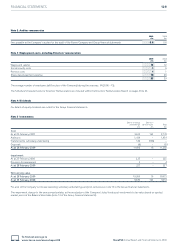
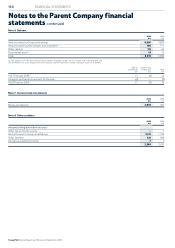
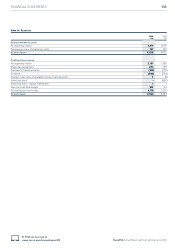
Note 2 Auditor remuneration
2009 2008
£m £m
Fees payable to the Company’s auditor for the audit of the Parent Company and Group financial statements 0. 6 0.6
Note 3 Employment costs, including Directors’ remuneration
2009 2008
£m £m
Wages and salaries 15 12
Social security costs 1 6
Pension costs 1 1
Share-based payment expense 18 20
35 39
The average number of employees (all Directors of the Company) during the year was: 14 (2008 – 15).
The Schedule VI requirements for Directors’ Remuneration are included within the Directors’ Remuneration Report on pages 50 to 64.
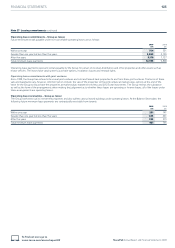
Note 4 Dividends
For details of equity dividends see note 8 in the Group financial statements.
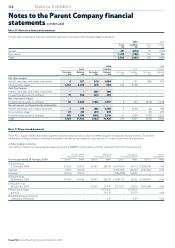
Note 5 Investments
Shares in Group Shares in
undertakings joint ventures Total
£m £m £m
Cost
As at 23 February 2008 9,612 162 9,774
Additions 1,434 – 1,434
Transferred to subsidiary undertaking 146 (146) –
Disposals (6) – (6)
As at 28 February 2009 11,186 16 11,202
Impairment
As at 23 February 2008 223 – 223
Provision for impairment 4 – 4
As at 28 February 2009 227 – 227
Net carrying value
As at 28 February 2009 10,959 16 10,975
As at 23 February 2008 9,389 162 9,551
For a list of the Company’s principal operating subsidiary undertakings and joint ventures see note 13 in the Group financial statements.
The impairment charge for the year primarily relates to the revaluation of the Company’s listed fixed asset investments to fair value based on quoted
market prices at the Balance Sheet date (note 14 of the Group financial statements).