Tesco 2009 Annual Report Download - page 133
Download and view the complete annual report
Please find page 133 of the 2009 Tesco annual report below. You can navigate through the pages in the report by either clicking on the pages listed below, or by using the keyword search tool below to find specific information within the annual report.-
 1
1 -
2
-
3
-
4
-
5
-
6
-
7
-
8
-
9
-
10
-
11
-
12
-
13
-
14
-
15
-
16
-
17
-
18
-
19
-
20
-
21
-
22
-
23
-
24
-
25
-
26
-
27
-
28
-
29
-
30
-
31
-
32
-
33
-
34
-
35
-
36
-
37
-
38
-
39
-
40
-
41
-
42
-
43
-
44
-
45
-
46
-
47
-
48
-
49
-
50
-
51
-
52
-
53
-
54
-
55
-
56
-
57
-
58
-
59
-
60
-
61
-
62
-
63
-
64
-
65
-
66
-
67
-
68
-
69
-
70
-
71
-
72
-
73
-
74
-
75
-
76
-
77
-
78
-
79
-
80
-
81
-
82
-
83
-
84
-
85
-
86
-
87
-
88
-
89
-
90
-
91
-
92
-
93
-
94
-
95
-
96
-
97
-
98
-
99
-
100
-
101
-
102
-
103
-
104
-
105
-
106
-
107
-
108
-
109
-
110
-
111
-
112
-
113
-
114
-
115
-
116
-
117
-
118
-
119
-
120
-
121
-
122
-
 123
123 -
 124
124 -
 125
125 -
 126
126 -
 127
127 -
 128
128 -
 129
129 -
 130
130 -
 131
131 -
 132
132 -
 133
133 -
 134
134 -
 135
135 -
 136
136 -
 137
137 -
 138
138 -
 139
139 -
 140
140
 |
 |

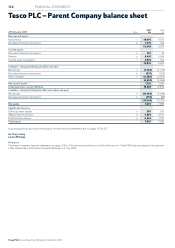
131
FINANCIAL STATEMENTS
Tesco PLC Annual Report and Financial Statements 2009
To find out more go to
www.tesco.com/annualreport09
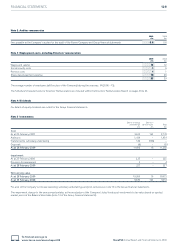
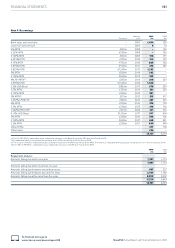
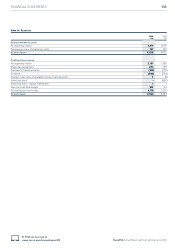
Note 9 Borrowings
Maturity 2009 2008
Par value year £m £m
Bank loans and overdrafts – 2009 1,494 538
Loan from joint venture – 2009 9 10
6% MTN £125m 2008 – 130
5.25% MTN €500m 2008 – 392
5.125% MTN £192m 2009 198 191
6.625% MTN £150m 2010 154 153
4.75% MTN €750m 2010 689 592
3.875% MTN €500m 2011 476 387
5.625% MTN €1,500m 2012 1,362 –
5% MTN £600m 2014 592 –
5.125% MTN €600m 2015 522 –
4% RPI MTN(a) £263m 2016 268 254
5.875% MTN €1,500m 2016 1,488 –
5.5% USD Bond $850m 2017 678 455
5.5% MTN £350m 2019 351 350
6.125% MTN £900m 2022 901 –
5% MTN(b) £515m 2023 515 417
3.322% LPI MTN(c) £265m 2025 267 255
6% MTN £200m 2029 216 194
5.5% MTN £200m 2033 216 192
1.982% RPI MTN(d) £221m 2036 221 212
6.15% USD Bond $1,150m 2037 977 604
5% MTN £300m 2042 306 305
5.125% MTN €600m 2047 628 451
5.2% MTN £500m 2057 500 499
Other MTNs – – 477 178
Other loans – – 226 –
13,731 6,759
(a) The 4% RPI MTN is redeemable at par, indexed for increases in the Retail Price Index (RPI) over the life of the MTN.
(b) An additional bond issue increased the principal of this MTN from £415m to £515m during 2009.
(c) The 3.322% LPI MTN is redeemable at par, indexed for increases in the RPI over the life of the MTN. The maximum indexation of the principal in any one year is 5%, with a minimum of 0%.
(d) The 1.982% RPI MTN is redeemable at par, indexed for increases in the RPI over the life of the MTN.
2009 2008
£m £m
Repayment analysis:
Amounts falling due within one year 1,981 1,114
1,981 1,114
Amounts falling due after more than one year:
Amounts falling due between one and two years 867 277
Amounts falling due between two and five years 2,784 1,166
Amounts falling due after more than five years 8,099 4,202
11,750 5,645
13,731 6 ,759