Tesco 2009 Annual Report Download - page 73
Download and view the complete annual report
Please find page 73 of the 2009 Tesco annual report below. You can navigate through the pages in the report by either clicking on the pages listed below, or by using the keyword search tool below to find specific information within the annual report.-
 1
1 -
2
-
3
-
4
-
5
-
6
-
7
-
8
-
9
-
10
-
11
-
12
-
13
-
14
-
15
-
16
-
17
-
18
-
19
-
20
-
21
-
22
-
23
-
24
-
25
-
26
-
27
-
28
-
29
-
30
-
31
-
32
-
33
-
34
-
35
-
36
-
37
-
38
-
39
-
40
-
41
-
42
-
43
-
44
-
45
-
46
-
47
-
48
-
49
-
50
-
51
-
52
-
53
-
54
-
55
-
56
-
57
-
58
-
59
-
60
-
61
-
62
-
 63
63 -
 64
64 -
 65
65 -
 66
66 -
 67
67 -
 68
68 -
 69
69 -
 70
70 -
 71
71 -
 72
72 -
 73
73 -
 74
74 -
 75
75 -
 76
76 -
 77
77 -
 78
78 -
 79
79 -
 80
80 -
 81
81 -
 82
82 -
 83
83 -
84
-
85
-
86
-
87
-
88
-
89
-
90
-
91
-
92
-
93
-
94
-
95
-
96
-
97
-
98
-
99
-
100
-
101
-
102
-
103
-
104
-
105
-
106
-
107
-
108
-
109
-
110
-
111
-
112
-
113
-
114
-
115
-
116
-
117
-
118
-
119
-
120
-
121
-
122
-
123
-
124
-
125
-
126
-
127
-
128
-
129
-
130
-
131
-
132
-
133
-
134
-
135
-
136
-
137
-
138
-
139
-
140
 |
 |

71
FINANCIAL STATEMENTS
Tesco PLC Annual Report and Financial Statements 2009
To find out more go to
www.tesco.com/annualreport09
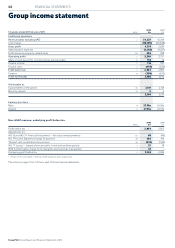
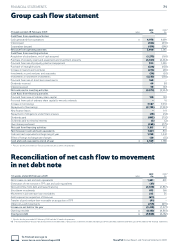
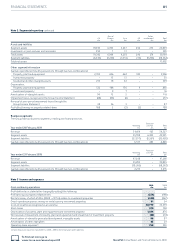
Group cash flow statement
2009 2008*
53 weeks ended 28 February 2009 notes £m £m
Cash flows from operating activities
Cash generated from operations 33 4,978 4,099
Interest paid (562) (410)
Corporation tax paid (456) (346)
Net cash from operating activities 3,960 3,343
Cash flows from investing activities
Acquisition of subsidiaries, net of cash acquired (1,275) (169)
Purchase of property, plant and equipment and investment property (4,487) (3,442)
Proceeds from sale of property, plant and equipment 994 1,056
Purchase of intangible assets (220) (158)
Increase in loans to joint ventures (242) (36)
Investments in joint ventures and associates (30) (61)
Investments in short-term investments (1,233) (360)
Proceeds from sale of short-term investments 360 –
Dividends received 69 88
Interest received 90 128
Net cash used in investing activities (5,974) (2,954)
Cash flows from financing activities
Proceeds from issue of ordinary share capital 130 138
Proceeds from sale of ordinary share capital to minority interests – 16
Increase in borrowings 7,387 9,333
Repayment of borrowings (2,733) ( 7,593)
New finance leases – 119
Repayment of obligations under finance leases (18) (32)
Dividends paid (883) (792)
Dividends paid to minority interests (3) (2)
Own shares purchased (265) (775)
Net cash from financing activities 3,615 412
Net increase in cash and cash equivalents 1,601 801
Cash and cash equivalents at beginning of year 1,788 1,042
Effect of foreign exchange rate changes 120 (55)
Cash and cash equivalents at end of year 19 3,509 1,788
* Results for the year ended 23 February 2008 include 52 weeks of operation.
Reconciliation of net cash flow to movement
in net debt note
2009 2008*
53 weeks ended 28 February 2009 notes £m £m
Net increase in cash and cash equivalents 1,601 801
Elimination of net increase in TPF cash and cash equivalents (37) –
Net cash inflow from debt and lease financing (4,636) (1,827)
Short-term investments 873 360
Movement in joint venture loan receivables 242 36
Debt acquired on acquisition of Homever (611) –
Transfer of joint venture loan receivable on acquisition of TPF (91) –
Other non-cash movements (759) (691)
Increase in net debt in the year (3,418) (1,321)
Opening net debt 34 (6,182) (4,861)
Closing net debt 34 (9,600) (6,182)
* Results for the year ended 23 February 2008 include 52 weeks of operation.
NB. The reconciliation of net cash flow to movement in net debt note is not a primary statement and does not form part of the cash flow statement and forms part of the notes to the financial statements.