Tesco 2009 Annual Report Download - page 4
Download and view the complete annual report
Please find page 4 of the 2009 Tesco annual report below. You can navigate through the pages in the report by either clicking on the pages listed below, or by using the keyword search tool below to find specific information within the annual report.-
 1
1 -
 2
2 -
 3
3 -
 4
4 -
 5
5 -
 6
6 -
 7
7 -
 8
8 -
 9
9 -
 10
10 -
 11
11 -
 12
12 -
 13
13 -
 14
14 -
 15
15 -
16
-
17
-
18
-
19
-
20
-
21
-
22
-
23
-
24
-
25
-
26
-
27
-
28
-
29
-
30
-
31
-
32
-
33
-
34
-
35
-
36
-
37
-
38
-
39
-
40
-
41
-
42
-
43
-
44
-
45
-
46
-
47
-
48
-
49
-
50
-
51
-
52
-
53
-
54
-
55
-
56
-
57
-
58
-
59
-
60
-
61
-
62
-
63
-
64
-
65
-
66
-
67
-
68
-
69
-
70
-
71
-
72
-
73
-
74
-
75
-
76
-
77
-
78
-
79
-
80
-
81
-
82
-
83
-
84
-
85
-
86
-
87
-
88
-
89
-
90
-
91
-
92
-
93
-
94
-
95
-
96
-
97
-
98
-
99
-
100
-
101
-
102
-
103
-
104
-
105
-
106
-
107
-
108
-
109
-
110
-
111
-
112
-
113
-
114
-
115
-
116
-
117
-
118
-
119
-
120
-
121
-
122
-
123
-
124
-
125
-
126
-
127
-
128
-
129
-
130
-
131
-
132
-
133
-
134
-
135
-
136
-
137
-
138
-
139
-
140
 |
 |

2
Tesco PLC Annual Report and Financial Statements 2009
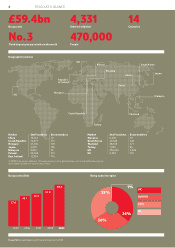
FINANCIAL HIGHLIGHTS
15.1%
Group sales
(including VAT)*
2009
2009 52 weeks
53 weeks pro-forma 2008
Group sales (£m) (including value added tax) 59,426 58,588 51,773
Group revenue (£m) (excluding value added tax) 54,327 53,552 47, 298
Underlying Group profit before tax (£m)*† 3,128 3,093 2,846
Group profit before tax (£m) 2,954 2,920 2,803
Underlying diluted earnings per share (p)** 28.92 – 27.02
Dividend per share (p) 11.96 – 10.90
Group enterprise value (£m) (market capitalisation plus net debt) 35,907 – 37,656
Return on capital employed 13.0%‡ – 12.9%§
* Sales & profit growth reported on a consistent basis (12 months versus 12 months) for China.
** Growth in underlying diluted EPS has been adjusted to reflect a constant tax rate year on year. Growth was 7.0% on a statutory basis.
† Adjusted for IAS 32, IAS 39, the net difference between the IAS 19 Income Statement charge and ‘normal’ cash contributions for pensions, IAS 17 ‘Leases’ (impact of annual uplifts
in rent and rent-free periods, and the IFRS 3 amortisation charge on intangible assets arising on the acquisition of Tesco Personal Finance (TPF).
‡ Excluding acquisitions of TPF and Homever, India start-up costs, and after adjusting for assets held for sale.
§ Using a ‘normalised’ tax rate before start-up costs in the US and Tesco Direct, and excludes the impact of foreign exchange in equity and our acquisition of a majority share of Dobbies.
10.0%
Underlying Group profit
before tax*†
5.5%
Group profit before tax*
11.0%
Underlying diluted earnings
per share**
2.6%
Diluted earnings per share
9.7%
Dividend per share
Good financial management and leading market
positions have served us well this year in the
face of a challenging consumer environment.
We will continue to pursue our long-term
strategy which will put us in an even stronger
position once our markets emerge from the
economic downturn.
All growth figures reported on a 53-week basis.