Tesco 2009 Annual Report Download - page 53
Download and view the complete annual report
Please find page 53 of the 2009 Tesco annual report below. You can navigate through the pages in the report by either clicking on the pages listed below, or by using the keyword search tool below to find specific information within the annual report.-
 1
1 -
2
-
3
-
4
-
5
-
6
-
7
-
8
-
9
-
10
-
11
-
12
-
13
-
14
-
15
-
16
-
17
-
18
-
19
-
20
-
21
-
22
-
23
-
24
-
25
-
26
-
27
-
28
-
29
-
30
-
31
-
32
-
33
-
34
-
35
-
36
-
37
-
38
-
39
-
40
-
41
-
42
-
 43
43 -
 44
44 -
 45
45 -
 46
46 -
 47
47 -
 48
48 -
 49
49 -
 50
50 -
 51
51 -
 52
52 -
 53
53 -
 54
54 -
 55
55 -
 56
56 -
 57
57 -
 58
58 -
 59
59 -
 60
60 -
 61
61 -
 62
62 -
 63
63 -
64
-
65
-
66
-
67
-
68
-
69
-
70
-
71
-
72
-
73
-
74
-
75
-
76
-
77
-
78
-
79
-
80
-
81
-
82
-
83
-
84
-
85
-
86
-
87
-
88
-
89
-
90
-
91
-
92
-
93
-
94
-
95
-
96
-
97
-
98
-
99
-
100
-
101
-
102
-
103
-
104
-
105
-
106
-
107
-
108
-
109
-
110
-
111
-
112
-
113
-
114
-
115
-
116
-
117
-
118
-
119
-
120
-
121
-
122
-
123
-
124
-
125
-
126
-
127
-
128
-
129
-
130
-
131
-
132
-
133
-
134
-
135
-
136
-
137
-
138
-
139
-
140
 |
 |

51
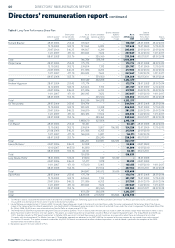
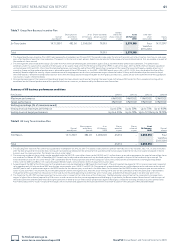
DIRECTORS’ REMUNERATION REPORT
Tesco PLC Annual Report and Financial Statements 2009
To find out more go to
www.tesco.com/annualreport09
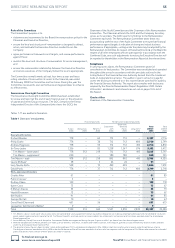
Performance related remuneration
The remuneration structures for Executive Directors and other key
executives are tailored to emphasise the delivery of strong year-on-year
earnings growth as well as sustained performance in the longer term.
More than two-thirds of total remuneration (excluding pension) is linked
to performance.
Long-term performance is rewarded through delivery of shares and short-
term performance through a combination of cash and compulsory deferred
shares. This ensures continued emphasis on strong annual performance
combined with long-term executive share ownership, providing a strong link
between the incentives received and shareholder value.
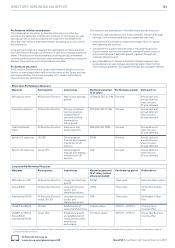
Performance measures
The Executive Directors have a range of performance targets across the
various incentive plans which reflect the objectives of the Group and their
own responsibilities. Targets are generally set to reward performance
improvement over prior periods.
The measures are summarised in the table below and are based on:
delivery of improved bottom-line financial results, measured through •
earnings, both in the present year and sustainably over time;
enhancement of profitability, measured through return on capital, •
whilst growing the business;
achievement of durable improvements in the underlying drivers •
of performance such as cost reduction, energy efficiency, reduced
environmental impact and sales growth, captured through the
corporate measures; and
laying foundations for future performance through measures such •
as developing new sales footage, developing people, implementing
community programmes, also captured through the corporate measures.
Short-term Performance Measures
Measures Participation Incentivises Maximum potential
% of salary
Performance period Delivered via
Earnings per share All Executive Directors Year on year earnings
growth
125% (US CEO 62.5%) One year Annual cash and
annual deferred
share bonuses
(3-year deferral)
Corporate objectives All Executive Directors Delivery of strategic
business priorities,
entrepreneurial
spirit and building
framework for
future growth
55% (US CEO 27.5%) One year Annual cash and
annual deferred
share bonuses
(3-year deferral)
Total shareholder
return
All Executive Directors Share price and
dividend growth
20% (US CEO 10%) One year Annual deferred
share bonuses
(3-year deferral)
Specific US objectives US CEO Delivery against
financial and strategic
milestones for US
business
200% One year Annual cash and
annual deferred
share bonuses
(3-year deferral)
Specific US objectives Group CEO Delivery against
financial and strategic
milestones for US
business
50% One year Annual deferred
share bonuses
(3-year deferral)
Long-term Performance Measures
Measures Participation Incentivises Maximum potential
% of salary (unless
otherwise stated)
Performance period Delivered via
EPS relative to RPI All Executive Directors Longer-term earnings
growth
200%* Three years Executive share options
Group ROCE All Executive Directors Long-term business
success and
shareholder returns
100% Three years Performance Share
Plan
International ROCE All Executive Directors
except US CEO
Long-term business
success and
shareholder returns
50% Three years Performance Share
Plan
US EBIT and ROCE US CEO Establishment of
successful US business
2 million shares 2010/11 – 2013/14 US Long Term
Incentive Plan
US EBIT and ROCE
Group ROCE
International ROCE
Group CEO Entrepreneurial spirit
and establishment of
new businesses within
whole Group
performance
2.5 million shares 2010/11 – 2013/14 Group New Business
Incentive Plan
* This is the amount on which the number of shares under option is calculated. The actual realisable value of these options will depend on any growth in share price between the date of
grant and the date of exercise.