Tesco 2009 Annual Report Download - page 84
Download and view the complete annual report
Please find page 84 of the 2009 Tesco annual report below. You can navigate through the pages in the report by either clicking on the pages listed below, or by using the keyword search tool below to find specific information within the annual report.-
 1
1 -
2
-
3
-
4
-
5
-
6
-
7
-
8
-
9
-
10
-
11
-
12
-
13
-
14
-
15
-
16
-
17
-
18
-
19
-
20
-
21
-
22
-
23
-
24
-
25
-
26
-
27
-
28
-
29
-
30
-
31
-
32
-
33
-
34
-
35
-
36
-
37
-
38
-
39
-
40
-
41
-
42
-
43
-
44
-
45
-
46
-
47
-
48
-
49
-
50
-
51
-
52
-
53
-
54
-
55
-
56
-
57
-
58
-
59
-
60
-
61
-
62
-
63
-
64
-
65
-
66
-
67
-
68
-
69
-
70
-
71
-
72
-
73
-
 74
74 -
 75
75 -
 76
76 -
 77
77 -
 78
78 -
 79
79 -
 80
80 -
 81
81 -
 82
82 -
 83
83 -
 84
84 -
 85
85 -
 86
86 -
 87
87 -
 88
88 -
 89
89 -
 90
90 -
 91
91 -
 92
92 -
 93
93 -
 94
94 -
95
-
96
-
97
-
98
-
99
-
100
-
101
-
102
-
103
-
104
-
105
-
106
-
107
-
108
-
109
-
110
-
111
-
112
-
113
-
114
-
115
-
116
-
117
-
118
-
119
-
120
-
121
-
122
-
123
-
124
-
125
-
126
-
127
-
128
-
129
-
130
-
131
-
132
-
133
-
134
-
135
-
136
-
137
-
138
-
139
-
140
 |
 |

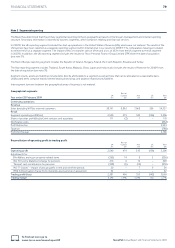
82 FINANCIAL STATEMENTS
Tesco PLC Annual Report and Financial Statements 2009
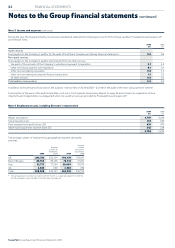
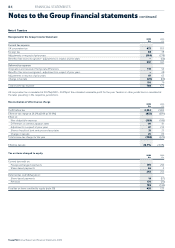
Note 3 Income and expenses continued
During the year, the Group (including its overseas subsidiaries) obtained the following services from the Group’s auditor, PricewaterhouseCoopers LLP,
and network firms:
2009 2008
£m £m
Audit services
Fees payable to the Company’s auditor for the audit of the Parent Company and Group financial statements 0.6 0.6
Non-audit services
Fees payable to the Company’s auditor and network firms for other services:
the audit of the accounts of the Company’s subsidiaries pursuant to legislation 3.1 2.5
other services pursuant to such legislation 0.1 0.1
other services relating to taxation 0.8 1.2
other services relating to corporate finance transactions 1.3 0.3
all other services 0.6 0.3
Total auditor remuneration 6.5 5.0
In addition to the amounts shown above, the auditors received fees of £0.1m (2008 – £0.1m) for the audit of the main Group pension scheme.
A description of the work of the Audit Committee is set out in the Corporate Governance Report on page 46 and includes an explanation of how
objectivity and independence is safeguarded when non-audit services are provided by PricewaterhouseCoopers LLP.
Note 4 Employment costs, including Directors’ remuneration
2009 2008
£m £m
Wages and salaries 4,707 4,246
Social security costs 410 349
Post-employment benefits (note 28) 439 470
Share-based payments expense (note 27) 242 228
5,798 5,293
The average number of employees by geographical segment during the
year was:
Average
Average number
number of of full-time
employees equivalents
2009 2008* 2009 2008*
UK 286,392 282,199 194,419 193,187
Rest of Europe 86,760 83,705 78,914 77, 267
Asia 92,773 77,554 88,099 74,570
US 2,583 669 2,583 730
Total 468,508 444,127 364,015 345,754
* The comparatives have been restated to reflect the US as a separate segment. In 2007/8,
the US employees were included in the UK reporting segment.
Notes to the Group financial statements continued