Tesco 2009 Annual Report Download - page 20
Download and view the complete annual report
Please find page 20 of the 2009 Tesco annual report below. You can navigate through the pages in the report by either clicking on the pages listed below, or by using the keyword search tool below to find specific information within the annual report.
18 REPORT OF THE DIRECTORS
Tesco PLC Annual Report and Financial Statements 2009
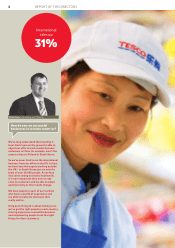
Market leader
We are market leader for clothing in
Hungary and the Czech Republic.
53m
Last year our international buying office
sourced over 53 million pairs of socks for
the Group.
Tesco’s large general merchandise business has been resilient despite
the challenges posed by weakening demand as consumers cut back
on discretionary spending. Price reductions, stronger promotions –
particularly of smaller ticket items – and a focus on particular categories
such as electronics, plus an excellent performance from Tesco Direct,
have supported good market share growth. The profitability of our
non-food business has also been pleasing.
UK non-food sales rose by 5% in the year, compared with 9% in
2007/8, with total non-food sales increasing to £8.7 billion (included in
reported UK sales). Second half like-for-like was encouraging, showing
a small improvement versus Quarter 2, with a stable performance in
Quarter 4 compared with Quarter 3.
We saw growth in some hardlines categories – particularly in
electrical goods, games and entertainment – and also in pharmacy.
Home related categories reflecting the slowdown in the housing
market, were more challenging – particularly furniture, DIY and
cookware. On a like-for-like basis, clothing sales reduced by 2%
in the year, but outperformed the market – with good growth in
menswear and an improving trend in childrenswear, with a stronger
second half performance.
Non-food continued
Non-food is an important part of a long-term strategy for growth.
It is a market which is similar in size to food and in which we only
have a small share so we see it as a big opportunity for us in the
future, irrespective of the economic climate.
Last year we opened over 600,000 square feet of new space for
non-food in the UK alone – including our latest non-food-only
Homeplus stores in Edinburgh and Nottingham – which means
more customers than ever have access to our offer in store. With
Tesco Direct we have made our widest non-food range available
to millions of customers who can’t get to one of our larger stores.
In fact, we get around 1.5 million visits to the website each week
and we’ve continued to roll-out Direct collection desks in store
so customers have the convenience of collecting their purchases
at the same time as doing their weekly shop, as well as having the
opportunity to have them delivered directly to their homes.
Have you cut back on the
amount of new space you
are adding for non-food?


