Square Enix 2014 Annual Report Download - page 67
Download and view the complete annual report
Please find page 67 of the 2014 Square Enix annual report below. You can navigate through the pages in the report by either clicking on the pages listed below, or by using the keyword search tool below to find specific information within the annual report.-
 1
1 -
2
-
3
-
4
-
5
-
6
-
7
-
8
-
9
-
10
-
11
-
12
-
13
-
14
-
15
-
16
-
17
-
18
-
19
-
20
-
21
-
22
-
23
-
24
-
25
-
26
-
27
-
28
-
29
-
30
-
31
-
32
-
33
-
34
-
35
-
36
-
37
-
38
-
39
-
40
-
41
-
42
-
43
-
44
-
45
-
46
-
47
-
48
-
49
-
50
-
51
-
52
-
53
-
54
-
55
-
56
-
 57
57 -
 58
58 -
 59
59 -
 60
60 -
 61
61 -
 62
62 -
 63
63 -
 64
64 -
 65
65 -
 66
66 -
 67
67 -
 68
68 -
 69
69 -
 70
70 -
 71
71 -
 72
72 -
 73
73 -
 74
74
 |
 |

65
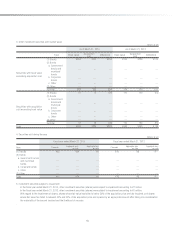
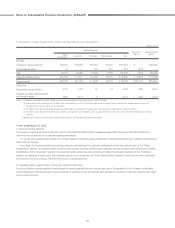
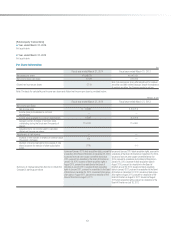
3. Information on sales, income (loss), assets and other items by reporting segment
Millions of yen
Reporting Segments Adjustment
(Note 1)
Consolidated total
(Note 2)
Digital
Entertainment Amusement Publication Merchandising Total
Net sales
(1) Sales to outside customers ¥89,482 ¥44,276 ¥11,086 ¥3,137 ¥147,981 ¥ — ¥147,981
(2) Intersegment sales 0 — 0 127 127 (127) —
Total 89,482 44,276 11,086 3,264 148,109 (127) 147,981
Segment operating income (loss) ¥ 44 ¥ (353) ¥ 2,484 ¥ 667 ¥ 2,842 ¥ (8,924) ¥ (6,081)
Segment assets ¥57,927 ¥19,192 ¥ 5,337 ¥3,065 ¥ 85,522 ¥116,986 ¥202,509
Other items
Depreciation and amortization 2,235 4,384 88 23 6,730 570 7,301
Increases in property and equipment
and intangible assets 3,339 4,934 199 84 8,558 3,950 12,508
Notes: 1 (1) Segment adjustments (¥8,924 million) include unallocated corporate operating expenses (¥8,965 million).
(2) Unallocated assets amounting to ¥116,986 million are included in the ¥117,043 million adjustment to segment assets. Most of this amount comprises funds for
management of surplus funds (cash and deposits).
(3) The ¥570 million adjustment to depreciation and amortization is associated with unallocated assets that do not belong to any reporting segment.
(4) The ¥3,950 million adjustment to increases in property and equipment and intangible assets is associated with unallocated assets that do not belong to any reporting
segment.
2 Segment operating income corresponds to operating income on the Consolidated Statement of Income.
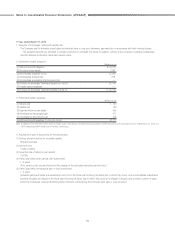
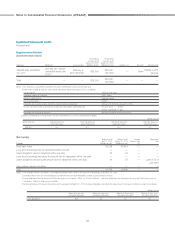
[Related Information]
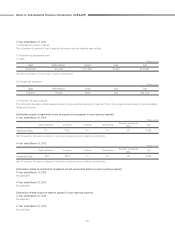
■ Year ended March 31, 2014
1. Information by product or service
This information is identical to that of segment information and has therefore been omitted.
2. Information by geographical area
(1) Sales
Millions of yen
Japan North America Europe Asia Total
¥111,326 ¥21,152 ¥19,732 ¥2,812 ¥155,023
Note: Sales are grouped by country or region, based on customer location.
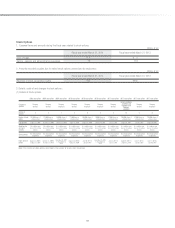
(2) Property and equipment
Millions of yen
Japan North America Europe Asia Total
¥17,664 ¥1,892 ¥318 ¥42 ¥19,917
3. Information by major customer
This information has been omitted because all sales to major customers account for less than 10% of the net sales amount shown on the Consolidated
Statement of Income.