Square Enix 2014 Annual Report Download - page 34
Download and view the complete annual report
Please find page 34 of the 2014 Square Enix annual report below. You can navigate through the pages in the report by either clicking on the pages listed below, or by using the keyword search tool below to find specific information within the annual report.-
 1
1 -
2
-
3
-
4
-
5
-
6
-
7
-
8
-
9
-
10
-
11
-
12
-
13
-
14
-
15
-
16
-
17
-
18
-
19
-
20
-
21
-
22
-
23
-
 24
24 -
 25
25 -
 26
26 -
 27
27 -
 28
28 -
 29
29 -
 30
30 -
 31
31 -
 32
32 -
 33
33 -
 34
34 -
 35
35 -
 36
36 -
 37
37 -
 38
38 -
 39
39 -
 40
40 -
 41
41 -
 42
42 -
 43
43 -
 44
44 -
45
-
46
-
47
-
48
-
49
-
50
-
51
-
52
-
53
-
54
-
55
-
56
-
57
-
58
-
59
-
60
-
61
-
62
-
63
-
64
-
65
-
66
-
67
-
68
-
69
-
70
-
71
-
72
-
73
-
74
 |
 |

32
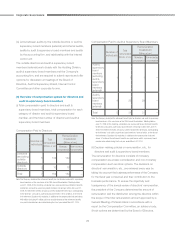
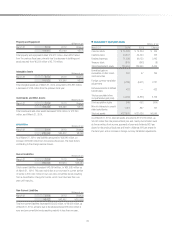
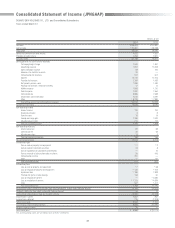
■ Consolidated Statement of Income
Net Sales and Operating Income Millions of yen
Years ended March 31 2014 Composition 2013 Composition Amount
change
Percent
change
Net sales ¥155,023 100.0% ¥147,981 100.0% ¥ 7,042 4.8%
Gross profi t 60,542 39.1% 49,192 33.2% 11,350 23.1%
Reversal of allowance for sales returns 4,672 3.0% 1,551 1.0% 3,121 201.2%
Provision for allowance for sales returns 4,458 2.9% 3,927 2.7% 531 13.5%
Net gross profi t 60,756 39.2% 46,817 31.6% 13,939 29.8%
Selling, general and administrative expenses 50,213 32.4% 52,899 35.7% (2,686) (5.1)%
Operating income (loss) ¥ 10,543 6.8% ¥ (6,081) — ¥16,624 —
Comparisons by segment with the previous fiscal year are provided on pages 12–15.
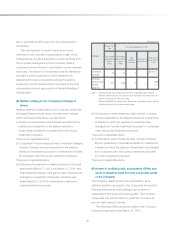
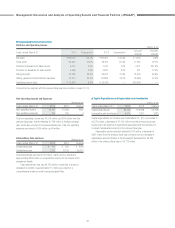
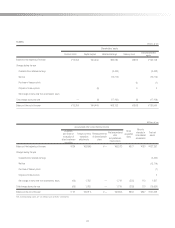
■ Capital Expenditures and Depreciation and Amortization
Millions of yen
Years ended March 31 2014 2013 Change
Capital expenditures ¥5,376 ¥12,508 ¥(7,132)
Depreciation and amortization
6,614 7,301 (687)
Capital expenditures for the fiscal year ended March 31, 2014, amounted to
¥5,376 million, a decrease of ¥7,132 million from the previous fiscal year,
mainly due to an absence of expenditures associated with the relocation of
Company headquarters incurred in the previous fiscal year.
Depreciation and amortization totaled ¥6,614 million, a decrease of
¥687 million from the previous fiscal year, primarily due to a decrease in
depreciation and amortization in the Amusement business from ¥4,384
million in the previous fiscal year to ¥2,713 million.
Non-Operating Income and Expenses
Millions of yen
Years ended March 31 2014 2013 Change
Non-operating income ¥2,150 ¥1,858 ¥292
Non-operating expenses 159 155 4
Total non-operating income was ¥2,150 million, up ¥292 million from the
previous fiscal year, mainly reflecting ¥1,798 million in foreign exchange
gain, which also occurred in the previous fiscal year. Total non-operating
expenses amounted to ¥159 million, up ¥4 million.
Extraordinary Gain and Loss Millions of yen
Years ended March 31 2014 2013 Change
Extraordinary gain ¥ 413 ¥ 653 ¥ (240)
Extraordinary loss 2,783 11,210 (8,427)
Total extraordinary gain was ¥413 million, mainly due to a booking of
approximately ¥350 million in compensation income for the closure of an
amusement facility.
Total extraordinary loss was ¥2,783 million, mainly due to a loss on
evaluation of content of approximately ¥1.7 billion as a result of a
comprehensive review on work-in-progress game titles.
Management Discussion and Analysis of Operating Results and Financial Position (JPNGAAP)