Square Enix 2014 Annual Report Download - page 32
Download and view the complete annual report
Please find page 32 of the 2014 Square Enix annual report below. You can navigate through the pages in the report by either clicking on the pages listed below, or by using the keyword search tool below to find specific information within the annual report.-
 1
1 -
2
-
3
-
4
-
5
-
6
-
7
-
8
-
9
-
10
-
11
-
12
-
13
-
14
-
15
-
16
-
17
-
18
-
19
-
20
-
21
-
 22
22 -
 23
23 -
 24
24 -
 25
25 -
 26
26 -
 27
27 -
 28
28 -
 29
29 -
 30
30 -
 31
31 -
 32
32 -
 33
33 -
 34
34 -
 35
35 -
 36
36 -
 37
37 -
 38
38 -
 39
39 -
 40
40 -
 41
41 -
 42
42 -
43
-
44
-
45
-
46
-
47
-
48
-
49
-
50
-
51
-
52
-
53
-
54
-
55
-
56
-
57
-
58
-
59
-
60
-
61
-
62
-
63
-
64
-
65
-
66
-
67
-
68
-
69
-
70
-
71
-
72
-
73
-
74
 |
 |

30
2. Analysis of Financial Policy, Capital Resources and
Liquidity
The Group meets its working capital and capital investment requirements
principally through internal funding resources and the issuance of corporate
bonds. As of March 31, 2014, the Group’s balance of interest-bearing debt
was ¥6,898 million. The net assets ratio stood at 58.3%. Cash and cash
equivalents at the end of the year totaled ¥113,507 million, an increase of
¥14,684 million from the previous fiscal year-end.
Cash flows in the fiscal year ended March 31, 2014, as well as the
principal factors behind these cash flows, are described below.
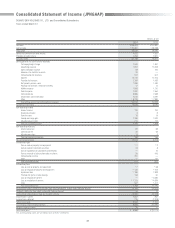
(1) Net cash provided by operating activities
Net cash provided by operating activities totaled ¥21,698 million, compared
with ¥110 million in the previous fiscal year. This position is primarily due to
income before income taxes and minority interests of ¥10,137 million,
increase in inventories of ¥2,601 million, decrease in notes and accounts
receivable of ¥10,779 million, and depreciation and amortization of ¥6,614
million.
(2) Net cash used in investing activities
Net cash used in investing activities totaled ¥5,962 million, a decrease of
35.1% from the previous fiscal year. The main factors are purchase of
property and equipment of ¥4,823 million, and purchase of intangible assets
of ¥566 million.
(3) Net cash used in financing activities
Net cash used in financing activities totaled ¥3,438 million, a decrease of
1.3% from the previous fiscal year. The primary application of funds was for
cash dividends paid of ¥3,446 million.
The Group believes that it will be possible to procure the funds required
for working capital and capital investments in the future to maintain growth
based on its sound financial standing and ability to generate cash through
operating activities.
3. Analysis of Business Performance in the Fiscal Year Ended
March 31, 2014
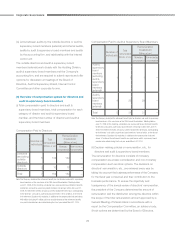
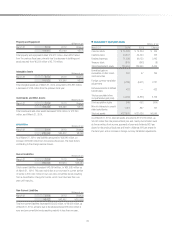
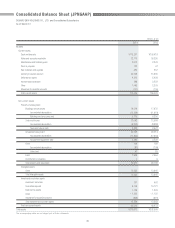
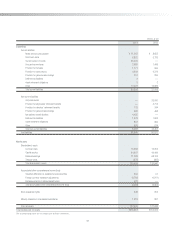
■ Assets
Total Assets Millions of yen
March 31 2014 2013 Change
¥216,617 ¥202,509 ¥14,108
Total assets as of March 31, 2014, amounted to ¥216,617 million, an
increase of ¥14,108 million from the previous fiscal year. The main factors
contributing to the change were as follows:
Cash and Deposits Millions of yen
March 31 2014 2013 Change
¥115,367 ¥100,418 ¥14,949
Cash and deposits as of March 31, 2014, increased ¥14,949 million, to
¥115,367 million, mainly reflecting an increase in cash flows from operating
activities, due to factors such as income before income taxes and minority
interests of ¥10,137 million as well as a decrease in notes and accounts
receivable of ¥10,779 million, among other factors.
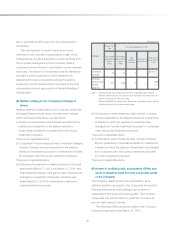
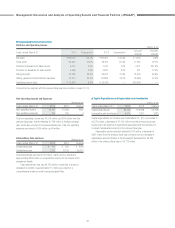
Notes and Accounts Receivable Millions of yen
March 31 2014 2013 Change
¥22,110 ¥30,226 ¥(8,116)
The year-end balance of notes and accounts receivable varies greatly
depending on the timing of new game title releases.
In the fiscal year ended March 31, 2014, notes and accounts receivable
decreased ¥8,116 million, to ¥22,110 million, mainly due to no releases of
major titles in March, while March of the previous fiscal year saw the release
of a big title, “Tomb Raider,” in Europe and North America.
Content Production Account Millions of yen
March 31 2014 2013 Change
¥20,556 ¥15,805 ¥4,751
As a rule, content development costs incurred during the period from a title’s
formal development authorization through to its release are capitalized in the
content production account. When the title is released, this amount is then
recorded as an expense. The content production account is appropriately
revalued in accordance with changes in the business environment.
As of March 31, 2014, the content production account totaled ¥20,556
million, an increase of ¥4,751 million from the previous fiscal year.
Management Discussion and Analysis of Operating Results and Financial Position (JPNGAAP)