Square Enix 2014 Annual Report Download - page 40
Download and view the complete annual report
Please find page 40 of the 2014 Square Enix annual report below. You can navigate through the pages in the report by either clicking on the pages listed below, or by using the keyword search tool below to find specific information within the annual report.-
 1
1 -
2
-
3
-
4
-
5
-
6
-
7
-
8
-
9
-
10
-
11
-
12
-
13
-
14
-
15
-
16
-
17
-
18
-
19
-
20
-
21
-
22
-
23
-
24
-
25
-
26
-
27
-
28
-
29
-
 30
30 -
 31
31 -
 32
32 -
 33
33 -
 34
34 -
 35
35 -
 36
36 -
 37
37 -
 38
38 -
 39
39 -
 40
40 -
 41
41 -
 42
42 -
 43
43 -
 44
44 -
 45
45 -
 46
46 -
 47
47 -
 48
48 -
 49
49 -
 50
50 -
51
-
52
-
53
-
54
-
55
-
56
-
57
-
58
-
59
-
60
-
61
-
62
-
63
-
64
-
65
-
66
-
67
-
68
-
69
-
70
-
71
-
72
-
73
-
74
 |
 |
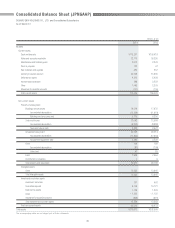
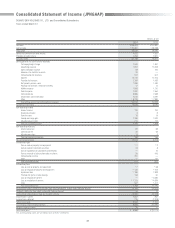
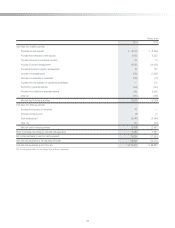
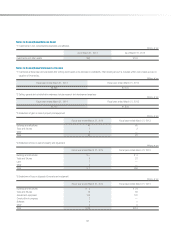
Millions of yen
2014 2013
Net sales ¥155,023 ¥147,981
Cost of sales *1 94,481 *1 98,788
Gross profi t 60,542 49,192
Reversal of provision for sales returns 4,672 1,551
Provision for sales returns 4,458 3,927
Net gross profi t 60,756 46,817
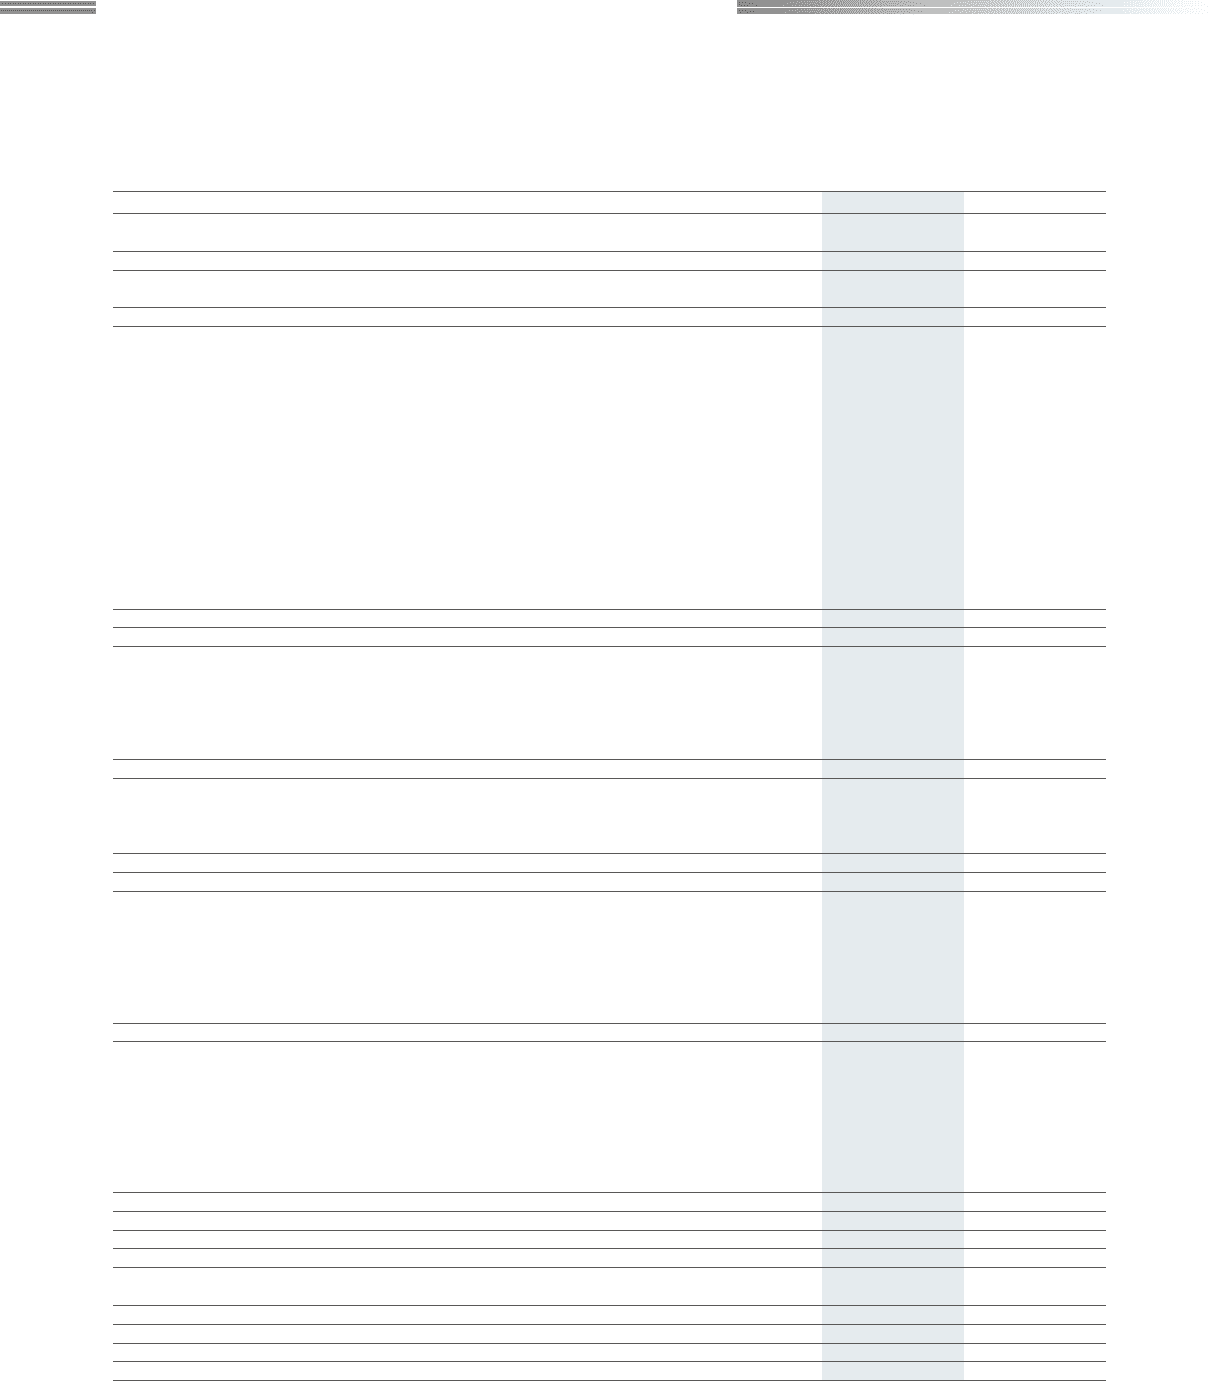
Selling, general and administrative expenses
Packaging freight charge 1,848 1,867
Advertising expense 7,913 12,309
Sales promotion expense 59 100
Allowance for doubtful accounts 36 —
Compensation for directors 572 607
Salaries 14,148 14,105
Provision for bonuses 2,193 1,483
Net periodic pension costs 1,088 1,484
Provision for directors’ retirement benefi ts 17 12
Welfare expense 1,846 1,710
Rental expense 1,652 1,554
Commission fee 9,596 7,588
Depreciation and amortization 2,512 2,091
Other *2 6,726 *2 7,984
Total selling, general and administrative expenses 50,213 52,899
Operating income (loss) 10,543 (6,081)
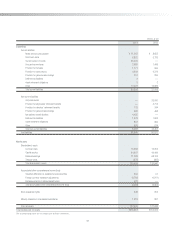
Non-operating income
Interest income 116 100
Dividends received 69
Rental income 18 14
Foreign exchange gain 1,798 1,620
Miscellaneous income 210 114
Total non-operating income 2,150 1,858
Non-operating expenses
Interest expenses 93 98
Commission fee 52 53
Miscellaneous loss 13 3
Total non-operating expenses 159 155
Recurring income (loss) 12,534 (4,378)
Extraordinary gain
Gain on sale of property and equipment *3 2*3 2
Gain on sale of investment securities 24 8
Gain on liquidation of subsidiaries and affi liates —76
Gain on reversal of subscription rights to shares 35 445
Compensation income 351 —
Other — 120
Total extraordinary gain 413 653
Extraordinary loss
Loss on sale of property and equipment *4 7*4 58
Loss on disposal of property and equipment *5 130 *5 213
Impairment loss *6 158 *6 939
Provision for game arcade closings 153 60
Loss on disposal of content — *7 3,696
Loss on evaluation of content *8 1,725 *8 4,834
Other 607 1,407
Total extraordinary loss 2,783 11,210
Income (loss) before dividends distribution from silent partnership, income taxes (tokumei-kumiai ) 10,164 (14,934)
Dividends distribution from silent partnership (tokumei-kumiai ) 26 13
Income (loss) before income taxes and minority interests 10,137 (14,948)
Income taxes–current 2,807 957
Income taxes–deferred 715 (2,208)
Total income taxes 3,522 (1,250)
Income (loss) before minority interests 6,615 (13,697)
Minority interests income 16 17
Net income (loss) ¥ 6,598 ¥ (13,714)
The accompanying notes are an integral part of these statements.
Consolidated Statement of Income (JPNGAAP)
SQUARE ENIX HOLDINGS CO., LTD. and Consolidated Subsidiaries
Years ended March 31
38