Square Enix 2014 Annual Report Download - page 66
Download and view the complete annual report
Please find page 66 of the 2014 Square Enix annual report below. You can navigate through the pages in the report by either clicking on the pages listed below, or by using the keyword search tool below to find specific information within the annual report.-
 1
1 -
2
-
3
-
4
-
5
-
6
-
7
-
8
-
9
-
10
-
11
-
12
-
13
-
14
-
15
-
16
-
17
-
18
-
19
-
20
-
21
-
22
-
23
-
24
-
25
-
26
-
27
-
28
-
29
-
30
-
31
-
32
-
33
-
34
-
35
-
36
-
37
-
38
-
39
-
40
-
41
-
42
-
43
-
44
-
45
-
46
-
47
-
48
-
49
-
50
-
51
-
52
-
53
-
54
-
55
-
 56
56 -
 57
57 -
 58
58 -
 59
59 -
 60
60 -
 61
61 -
 62
62 -
 63
63 -
 64
64 -
 65
65 -
 66
66 -
 67
67 -
 68
68 -
 69
69 -
 70
70 -
 71
71 -
 72
72 -
 73
73 -
 74
74
 |
 |

64
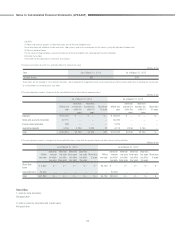
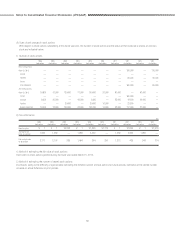
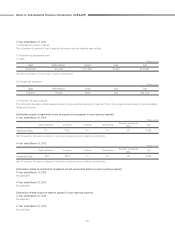
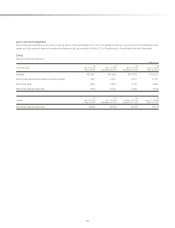
3. Information on sales, income (loss), assets and other items by reporting segment
Millions of yen
Reporting Segments Adjustment
(Note 1)
Consolidated total
(Note 2)
Digital
Entertainment Amusement Publication Merchandising Total
Net sales
(1) Sales to outside customers ¥94,564 ¥46,952 ¥10,030 ¥3,475 ¥155,023 ¥ — ¥155,023
(2) Intersegment sales 6 — 197 310 514 (514) —
Total 94,571 46,952 10,228 3,786 155,538 (514) 155,023
Segment operating income ¥10,709 ¥ 4,517 ¥ 2,293 ¥1,115 ¥ 18,635 ¥ (8,091) ¥ 10,543
Segment assets ¥60,708 ¥17,243 ¥ 4,739 ¥3,772 ¥ 86,463 ¥130,153 ¥216,617
Other items
Depreciation and amortization 3,197 2,713 89 27 6,028 585 6,614
Increases in property and equipment
and intangible assets 1,839 3,171 2 — 5,014 362 5,376
Notes: 1 (1) Segment adjustments (¥8,091 million) include unallocated corporate operating expenses (¥8,124 million).
(2) Unallocated assets amounting to ¥130,346 million are included in the ¥130,153 million adjustment to segment assets. Most of this amount comprises funds for
management of surplus funds (cash and deposits).
(3) The ¥585 million adjustment to depreciation and amortization is associated with unallocated assets that do not belong to any reporting segment.
(4) The ¥362 million adjustment to increases in property and equipment and intangible assets is associated with unallocated assets that do not belong to any reporting
segment.
2 Segment operating income corresponds to operating income on the Consolidated Statement of Income.
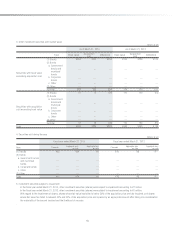
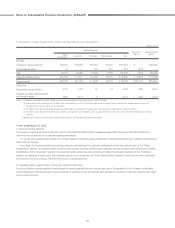
■ Year ended March 31, 2013
1. Outline of reporting segments
The Company’s reporting segments are business units for which abstracted financial data is available and periodically reviewed by the Board of Directors to
determine resource allocation and to evaluate business performance.
In a rapidly evolving business environment, the Company seeks to provide high-quality entertainment content and services through a variety of environments to
match customer lifestyles.
Accordingly, the Company maintains four business segments, each dedicated to a particular entertainment content and service format: (1) the “Digital
Entertainment” segment, for interactive digital content for game consoles (including handheld game machines), personal computers and mobile phones (including
smartphones); (2) the “Amusement” segment, for amusement facility operation as well as the sale and rental of arcade game machines; (3) the “Publication”
segment, for publication of comic books, game strategy books and comic magazines; and (4) the “Merchandising” segment, for planning, production, distribution
and licensing of derivative products. These are the Company’s reporting segments.
2. Calculating reporting segment sales, income (loss), assets and other items
Accounting treatment methods applied to financial results of reporting segments are the same as those used in the preparation of the Company’s consolidated
financial statements. Reporting segment income corresponds to operating income. Intersegment sales are based on prevailing prices in the market for the content
and/or services provided.
Notes to Consolidated Financial Statements (JPNGAAP)