Square Enix 2014 Annual Report Download - page 62
Download and view the complete annual report
Please find page 62 of the 2014 Square Enix annual report below. You can navigate through the pages in the report by either clicking on the pages listed below, or by using the keyword search tool below to find specific information within the annual report.-
 1
1 -
2
-
3
-
4
-
5
-
6
-
7
-
8
-
9
-
10
-
11
-
12
-
13
-
14
-
15
-
16
-
17
-
18
-
19
-
20
-
21
-
22
-
23
-
24
-
25
-
26
-
27
-
28
-
29
-
30
-
31
-
32
-
33
-
34
-
35
-
36
-
37
-
38
-
39
-
40
-
41
-
42
-
43
-
44
-
45
-
46
-
47
-
48
-
49
-
50
-
51
-
 52
52 -
 53
53 -
 54
54 -
 55
55 -
 56
56 -
 57
57 -
 58
58 -
 59
59 -
 60
60 -
 61
61 -
 62
62 -
 63
63 -
 64
64 -
 65
65 -
 66
66 -
 67
67 -
 68
68 -
 69
69 -
 70
70 -
 71
71 -
 72
72 -
73
-
74
 |
 |

60
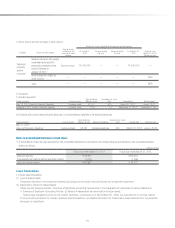
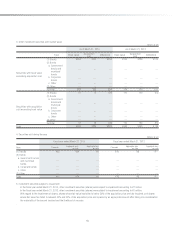
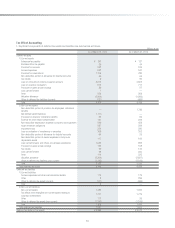
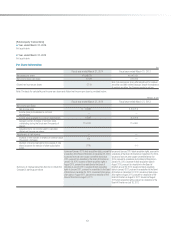
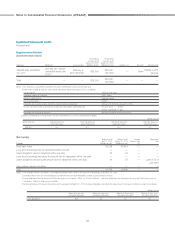
(2) Scale of and changes in stock options
With respect to stock options outstanding at this fiscal year-end, the number of stock options and the status of their exercise to shares of common
stock are indicated below:
1) Number of stock options
2008
stock options
2009
stock options
2009
stock options
2010
stock options
2010
stock options
2010
stock options
2011
stock options
2011
stock options
2012
stock options
2012
stock options
Before vesting (shares)
March 31, 2013
— — — — — — — 180,000 — 110,000
Granted
——————————
Forfeited
— — — — — — — 20,000 — 30,000
Vested
——————————
Unvested balance
— — — — — — — 160,000 — 80,000
After vesting (shares)
March 31, 2013
19,800 57,000 130,000 77,000 140,000 20,000 87,000 — 67,000 —
Vested
— — — — — — — 160,000 — —
Exercised
9,300 30,000 — 45,000 6,300 — 55,000 19,500 40,000 —
Forfeited
— — 30,000 — 30,000 10,000 — 23,500 — —
Balance unexercised
10,500 27,000 100,000 32,000 103,700 10,000 32,000 117,000 27,000 —
2) Price information
Yen
2008
stock options
2009
stock options
2009
stock options
2010
stock options
2010
stock options
2010
stock options
2011
stock options
2011
stock options
2012
stock options
2012
stock options
Exercise price ¥ 1 ¥ 1 ¥2,293 ¥ 1 ¥1,895 ¥1,779 ¥ 1 ¥1,835 ¥ 1 ¥1,515
Average share
price at exercise 1,289 1,289 — 1,289 2,432 — 1,289 2,365 1,289 —
Fair market value
on grant date 3,171 2,107 385 1,464 364 250 1,312 435 948 214
4. Method of estimating the fair value of stock options:
There were no stock options granted during the fiscal year ended March 31, 2014.
5. Method of estimating the number of vested stock options:
In principle, owing to the difficulty of appropriately estimating the forfeited number of stock options for future periods, estimation of the vested number
is based on actual forfeitures in prior periods.
Notes to Consolidated Financial Statements (JPNGAAP)